¶ Introduction
In 3decision you can easily display one (or multiple) electron density maps in the 3D Viewer. You can fetch maps on-the-fly for public structures, and also store and visualize maps for proprietary data.
You can find dedicated tutorials for fetching electron density maps for public structures and for [proprietary structures] in this documentation.
Once the electron density map is loaded in the 3D Viewer, you can customize representation settings such as contour level, clipping box size, or coloring.
¶ Public data
For public structures, electron density maps can be fetched on-the-fly from public servers and displayed in the 3D Viewer.
The option can be found in the Workspace, in the Structure Actions menu of individual structure cards (see image below):
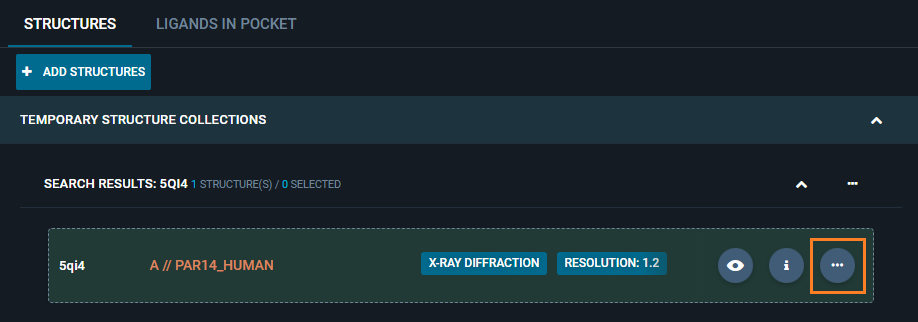
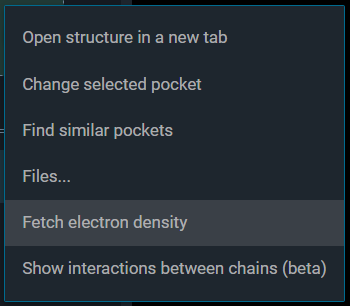
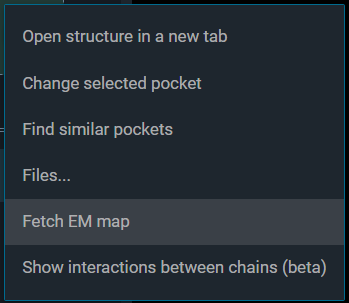
Here you will find one of the following two options enabled:
Fetch electron density: for X-Ray crystal structuresFetch EM map: for Cryo-EM structures
¶ Crystallographic maps
For public X-Ray crystal structures, electron density maps are fetched from the EBI-PDBe server, in the ccp4 format.
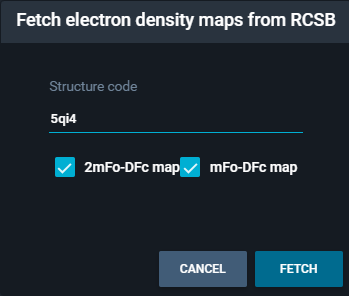
By clicking on the Fetch electron density option from the Structure Action Menu, you have the possibility to retrieve the "2Fo-Fc" and/or "Fo-Fc" map.
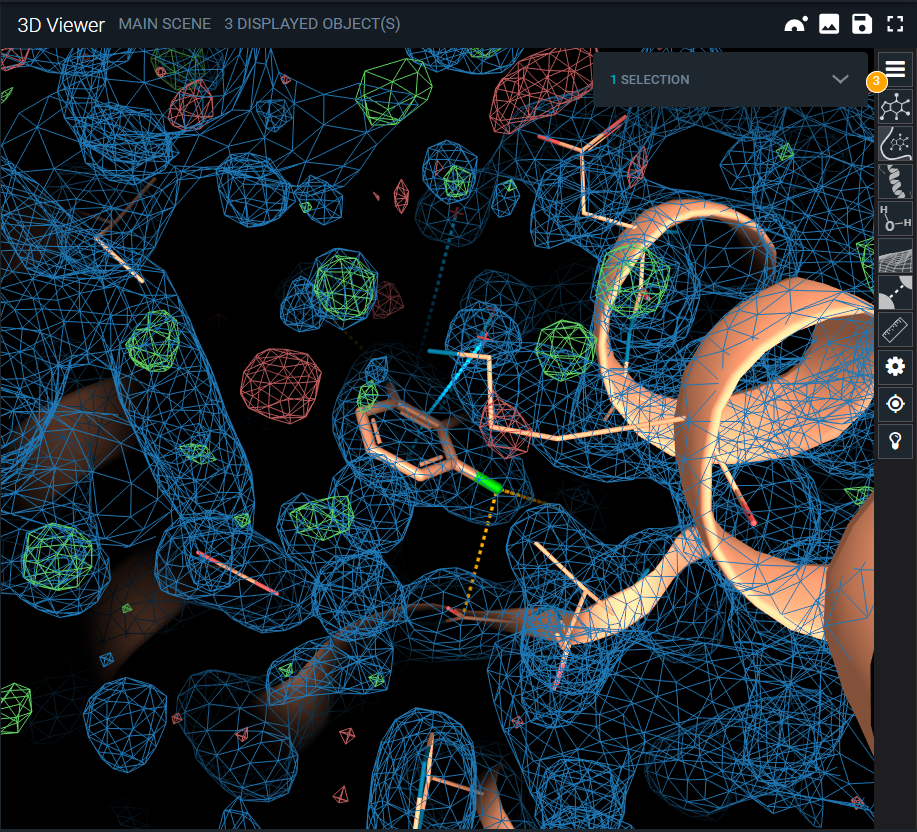
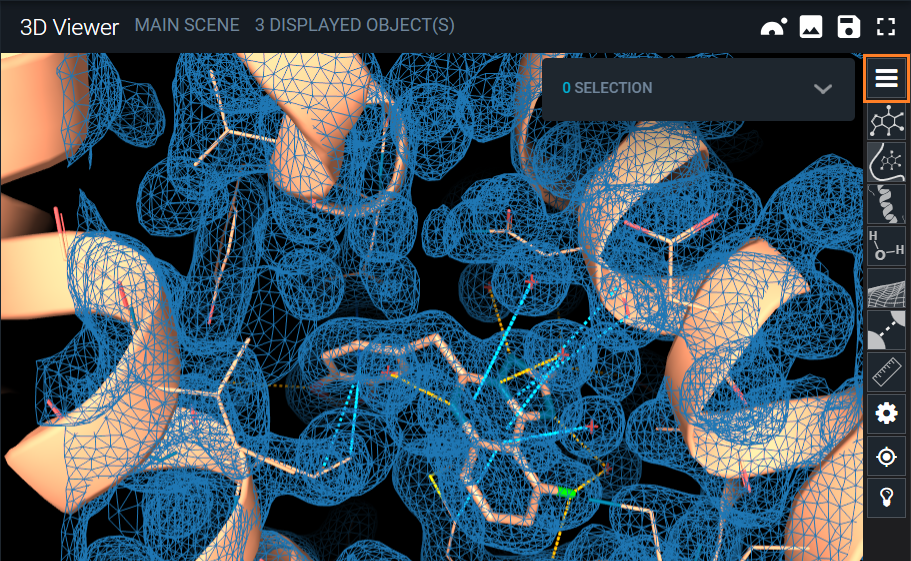
By default in the 3D Viewer, the 2Fo-Fc map is represented in blue mesh at the isovalue 1, whereas the Fo-Fc map is represented by two mesh surfaces - one in green at +3 and one in red at -3. Similarly to COOT, a negative electron density difference will thus show up as a red blob, and a positive difference as a green one.
For editing the representation of the maps, refer to the last section of this page "Electron density maps settings editing".
¶ Cryo-EM maps
For public cryo-EM structures, the EM map is fetched from the EMDB server. Information on the correct map isolevel is also retreived from the same source (if no isolevel is provided, it will be set to 1).
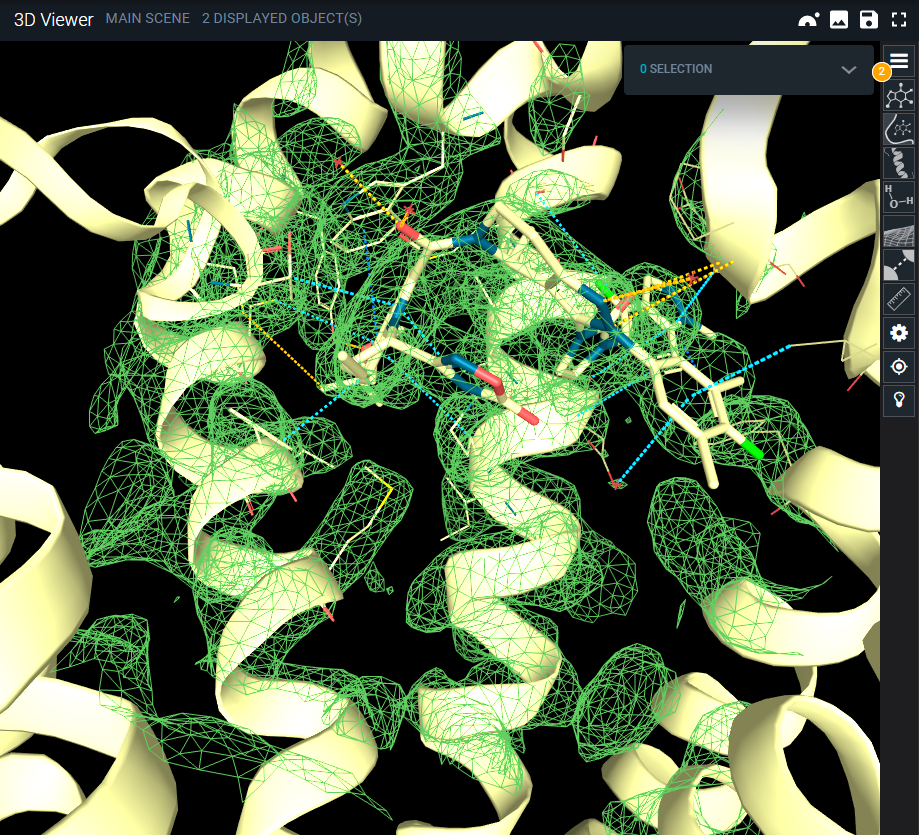
By default, the EM maps are represented as a green mesh in the 3D Viewer. For editing the representation of the map, refer to the last section of this page "Electron density maps settings editing".
¶ Proprietary data
In order to display the electron density map of a proprietary structure, the map or structure factor file needs to be provided as an 'associated files'.
Remember that you can add associated files to a structure:
- From the UI: from the FILES tab in the Information Browser.
- From the API: step-by-step guide in the API documentation.
¶ Display proprietary maps
To visualize proprietary electron density maps in the 3D Viewer, you need first to open the structure in the 3decision Workspace, and then access attached files to a structure. You have two options:
- From the Information Browser
- From the Action Menu
¶ From the Information Browser
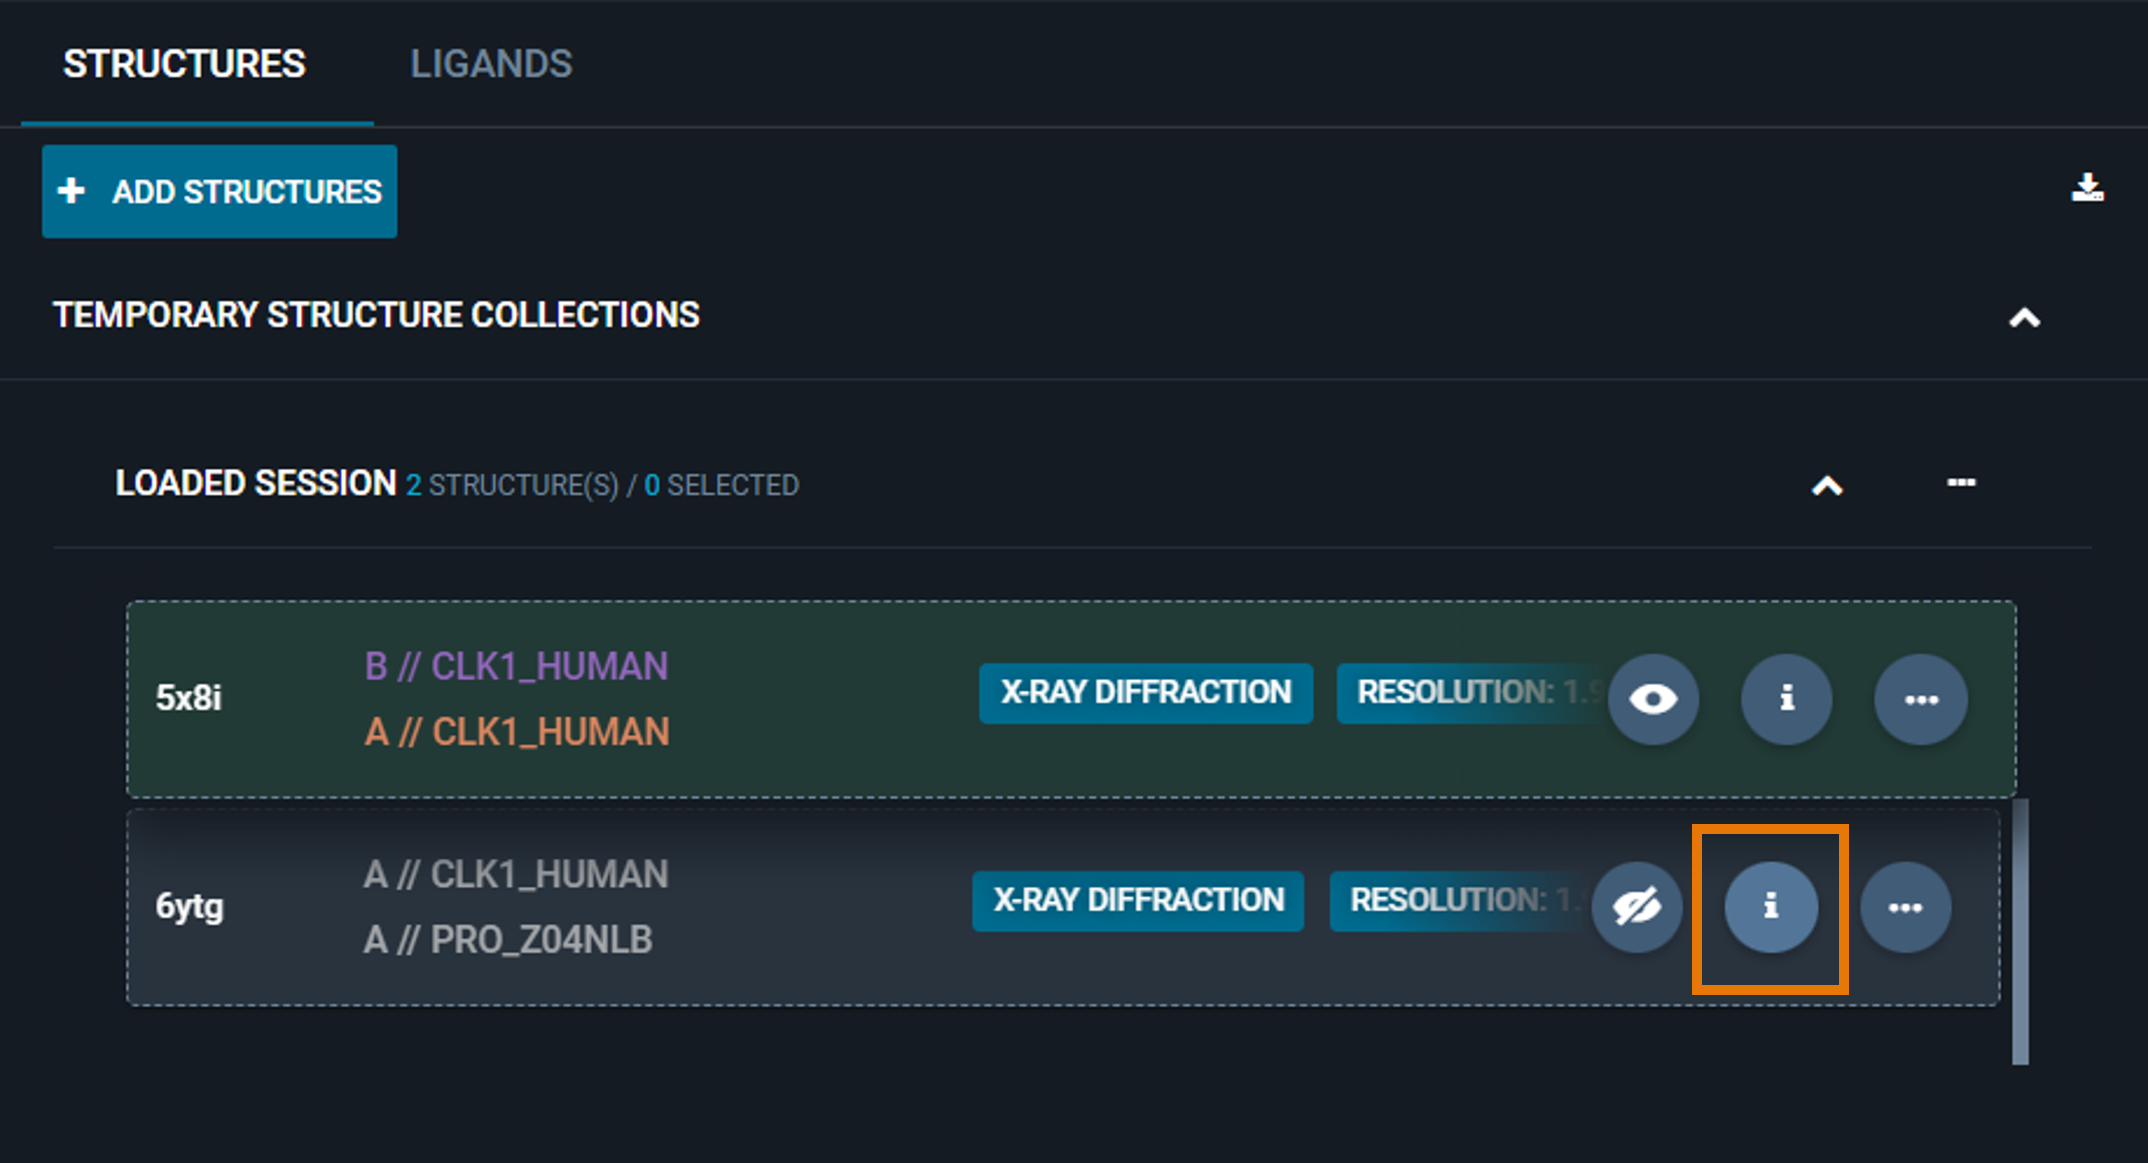
Open the structure Information panel by clicking on the i icon of the structure card of interest in the Workspace:
Once the Information Browser is opened, select the FILES tab from the header section of the panel:
All provided associated files can be found under the section Associated files. To display a map, click on the eye-icon (or FO/2FO-icon) next to the file name.
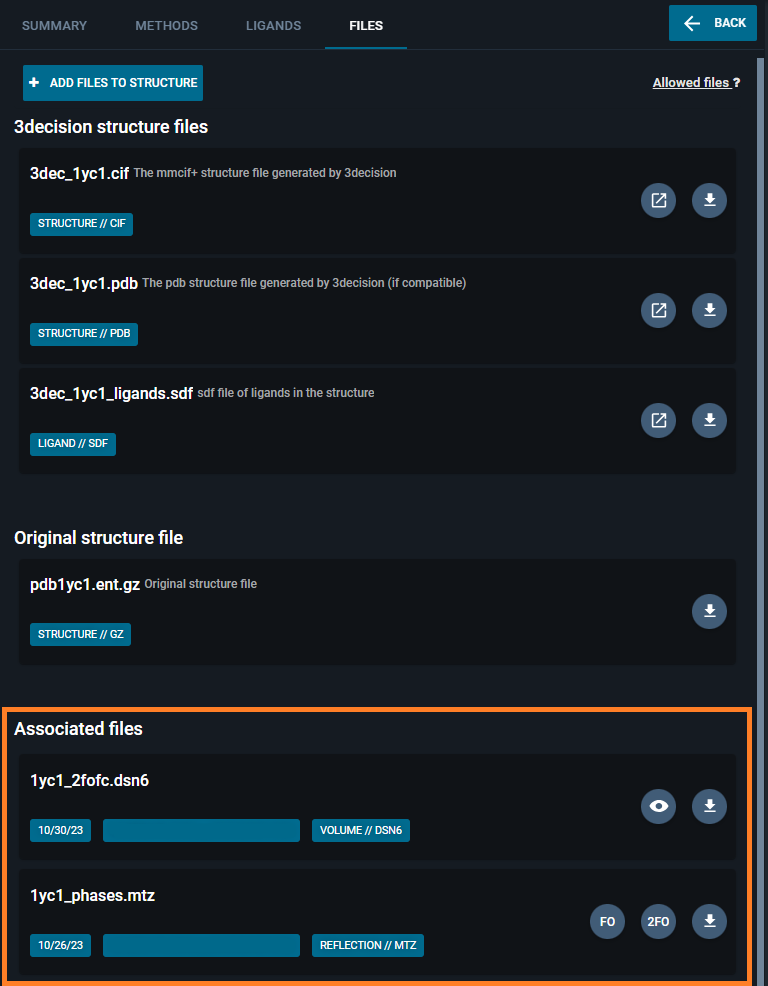
- For density map files (such as dsn6 or ccp4), you will have an eye-icon available in the file card. Clicking this button, the corresponding map will be displayed in the 3D Viewer.
- For mtz files, you will have two buttons available: the Fo button, to display the Fo-Fc map; and the 2Fo, to display the 2Fo-Fc map. By clicking one of these buttons, an on-the-fly calculation of the map from the mtz file will be triggered. Once the calculation is finished, the map will be displayed in the 3D Viewer
¶ From the Action Menu
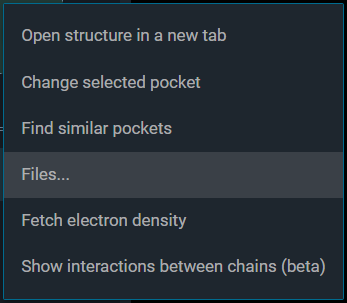
Open the action menu by clicking on the ... icon of the structure card of interest in the Workspace:
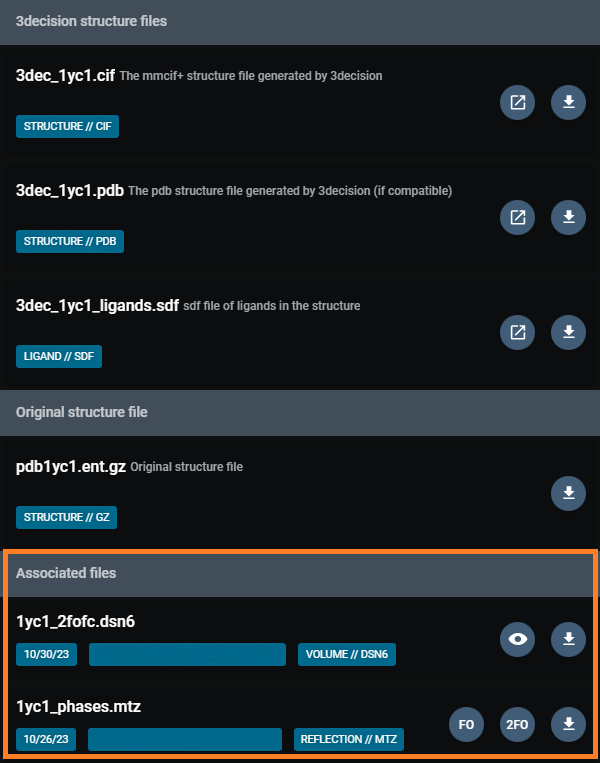
Then select the option Files... to access the list of available files for the structure:
All provided associated files can be found under the section Associated files. Map files will have the eye-icon for visualization, while mtz files will have the Fo and 2Fo button to display the corresponding map. Clicking on these button will allow the visualization of maps in the 3D Viewer.
¶ Maps compatibility
Density map files formats compatible with the 3D Viewer are:
mrc; map; ccp4; cube; cub; dsn6; brix; dx; dxbin; xplor; cns (reference)
The naming convention for density maps to be properly recognized in 3decision is the following:
- density map : XXXX_phases_2mFo-DFc.map
- difference map : XXXX_phases_mFo-DFc.map
3decision supports the display of .MTZ files if the provided file already contains the map coefficients.
For .MTZ files, the electron density maps are calculated on-the-fly by the application:
- 2Fo maps are calculated from the .mtz file using the WT, PHWT or 2FOFCWT, PH2FOFCWT map coefficients.
- Fo maps are calculated from the .mtz file using the DELFWT, PHDELWT or FOFCWT, PHFOFCWT map coefficients.
¶ Electron density map settings editing
To edit the settings of a displayed map, you need to open the 3D Viewer's Object panel:
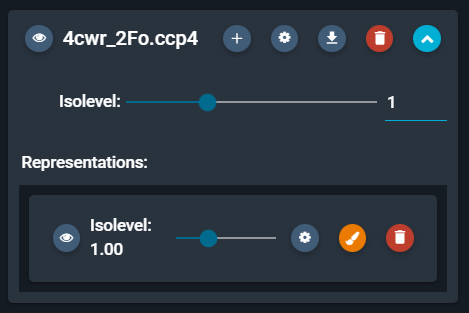
Here you'll find the electron density map as a distinct object:
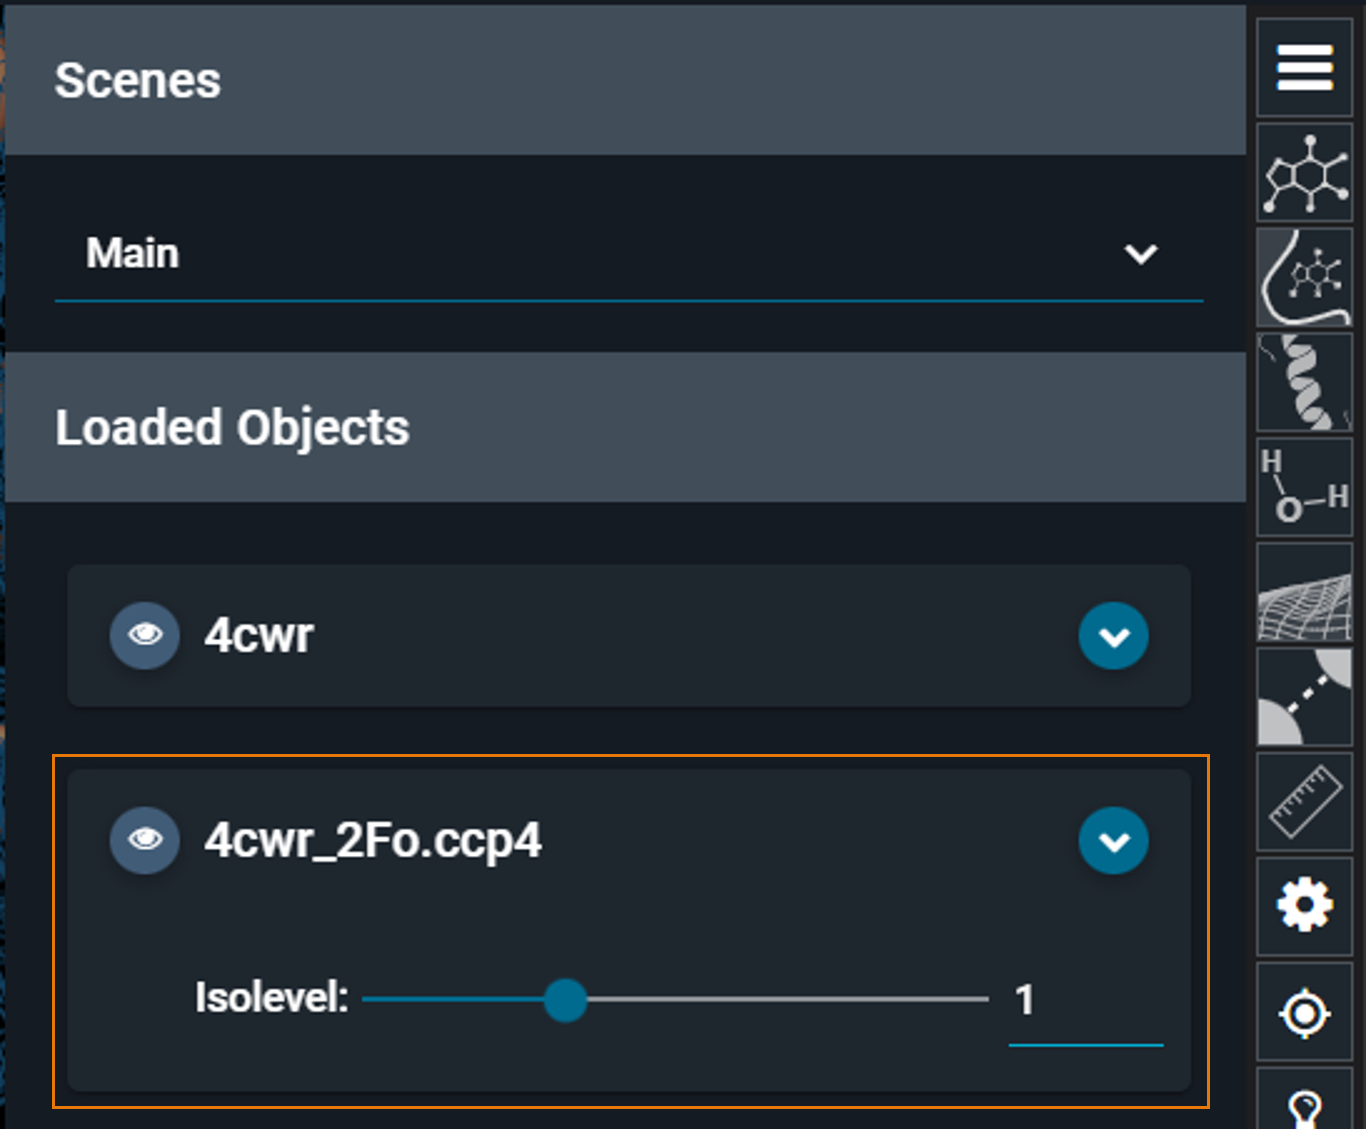
The contour level of the map can be ajusted with the isolevel slider on the map card.
If you hover with your mouse on the map card, additional buttons will appear:
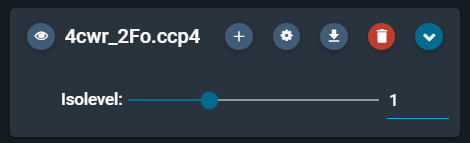
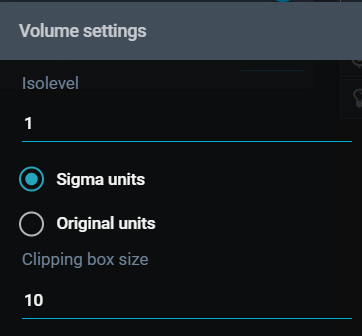
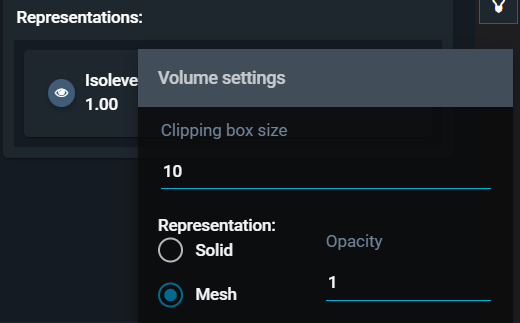
By clicking the cogwheel icon, you open the Volume settings where you can customize the isolevel units (sigma units and orginal units), and adjust the clipping box size (Ångström units):
These settings act on all representations of a map. To access more detailed settings, click on the blue arrow icon that unfolds all representations for your map (see next section).
¶ Representation settings
Once you have clicked the blue arrow on the right of the map card, you will see a list of map representations. If you hover with your mouse next to the isolevel bar, additional buttons will appear:
- volume settings (cogwheel icon)
- color settings (brush icon)
- delete representation
By clicking the cogwheel icon, you can customize the clipping box size of the map representation, and change the representation from mesh to solid, and adjust the opacity.
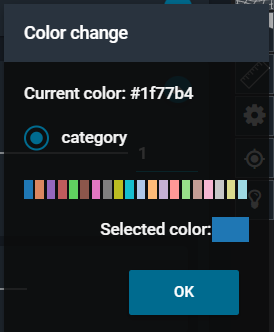
By clicking on the orange brush button, you can edit the color of the map representation. This can be particularly useful when you have multiple electron densities overlayed in the 3D Viewer.