¶ Introduction
In this short tutorial, you will see how to display electron density maps on public domain structures, for X-ray and CryoEM structures. You will also learn how to interact with them.
¶ How to register properly your density maps?
When you upload density map files, the naming convention for density maps to be properly recognized in 3decision is the following (dns6 and ccp4 map formats are handled) :
- density map : XXXX_phases_2mFo-DFc.map
- difference map : XXXX_phases_mFo-DFc.map
¶ Tutorial for crystallographic structures
¶ Loading structures
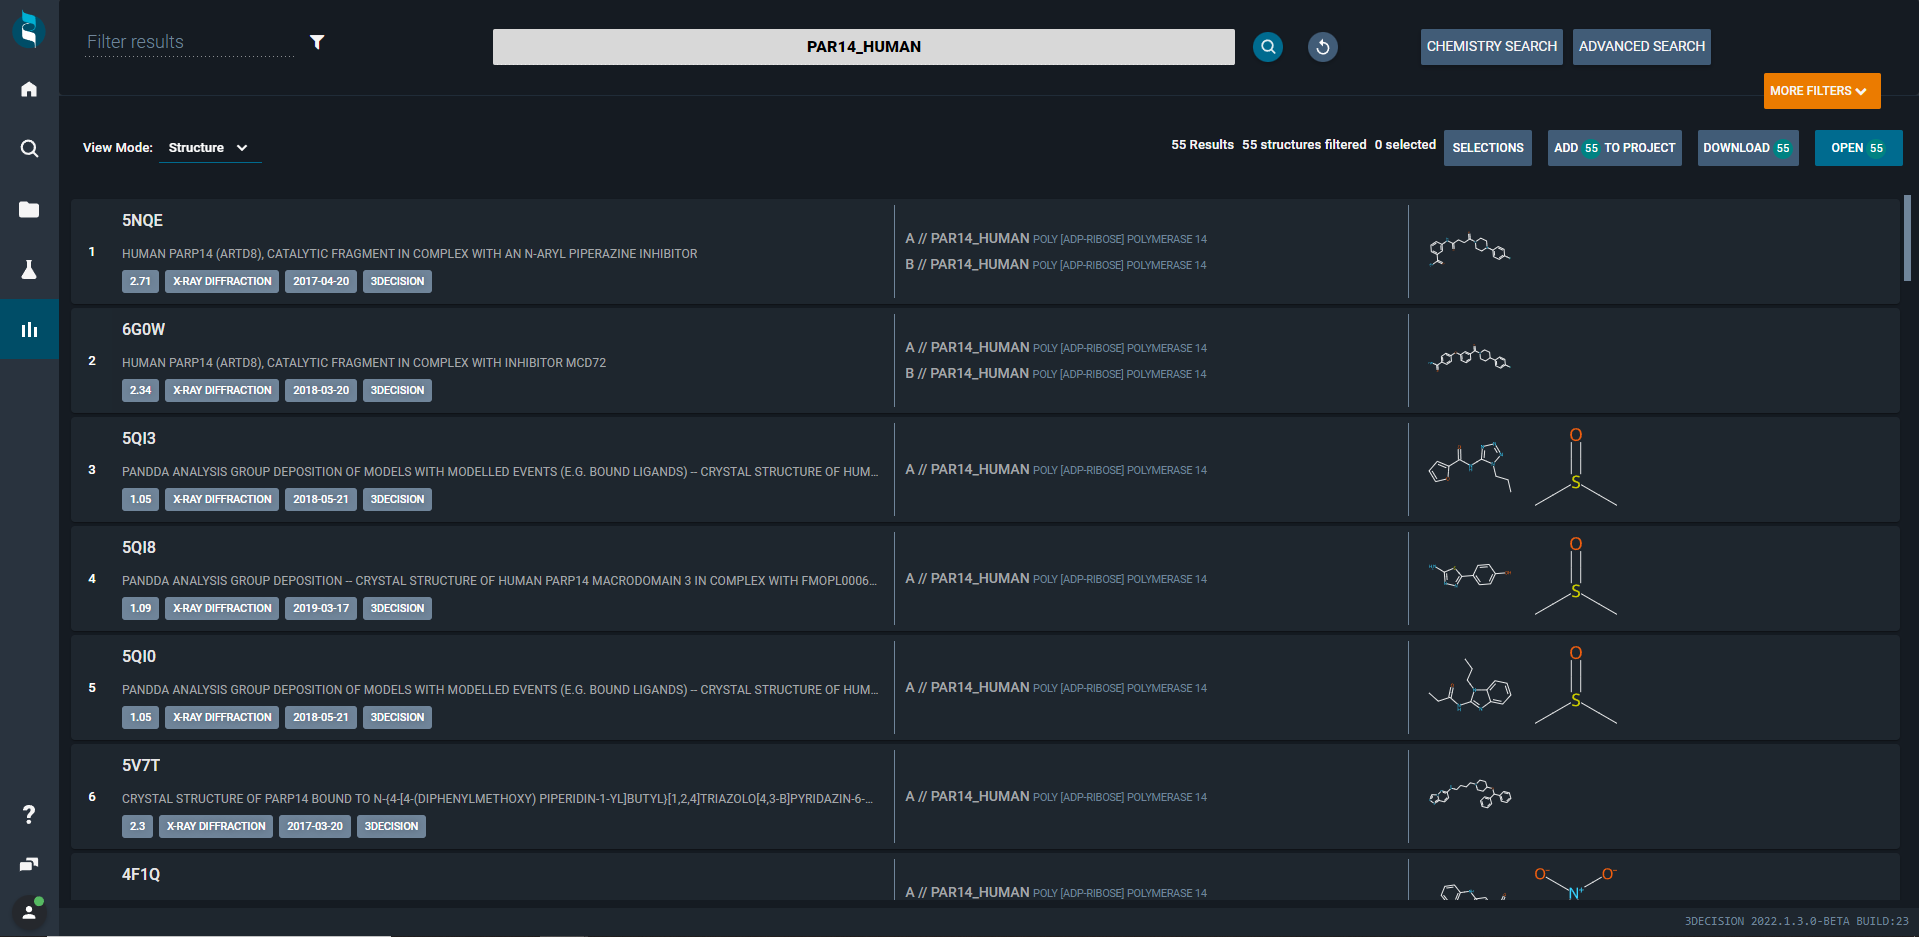
Search and select a set of structures of interest. For this example, a Uniprot code is used to run a search: PAR14_HUMAN
Then, filter the list of results to structures containing 5QI in their 4-letter code using the little search field at the top left of the screen. Select two structures of interest, by single clicking on the corresponding lines :
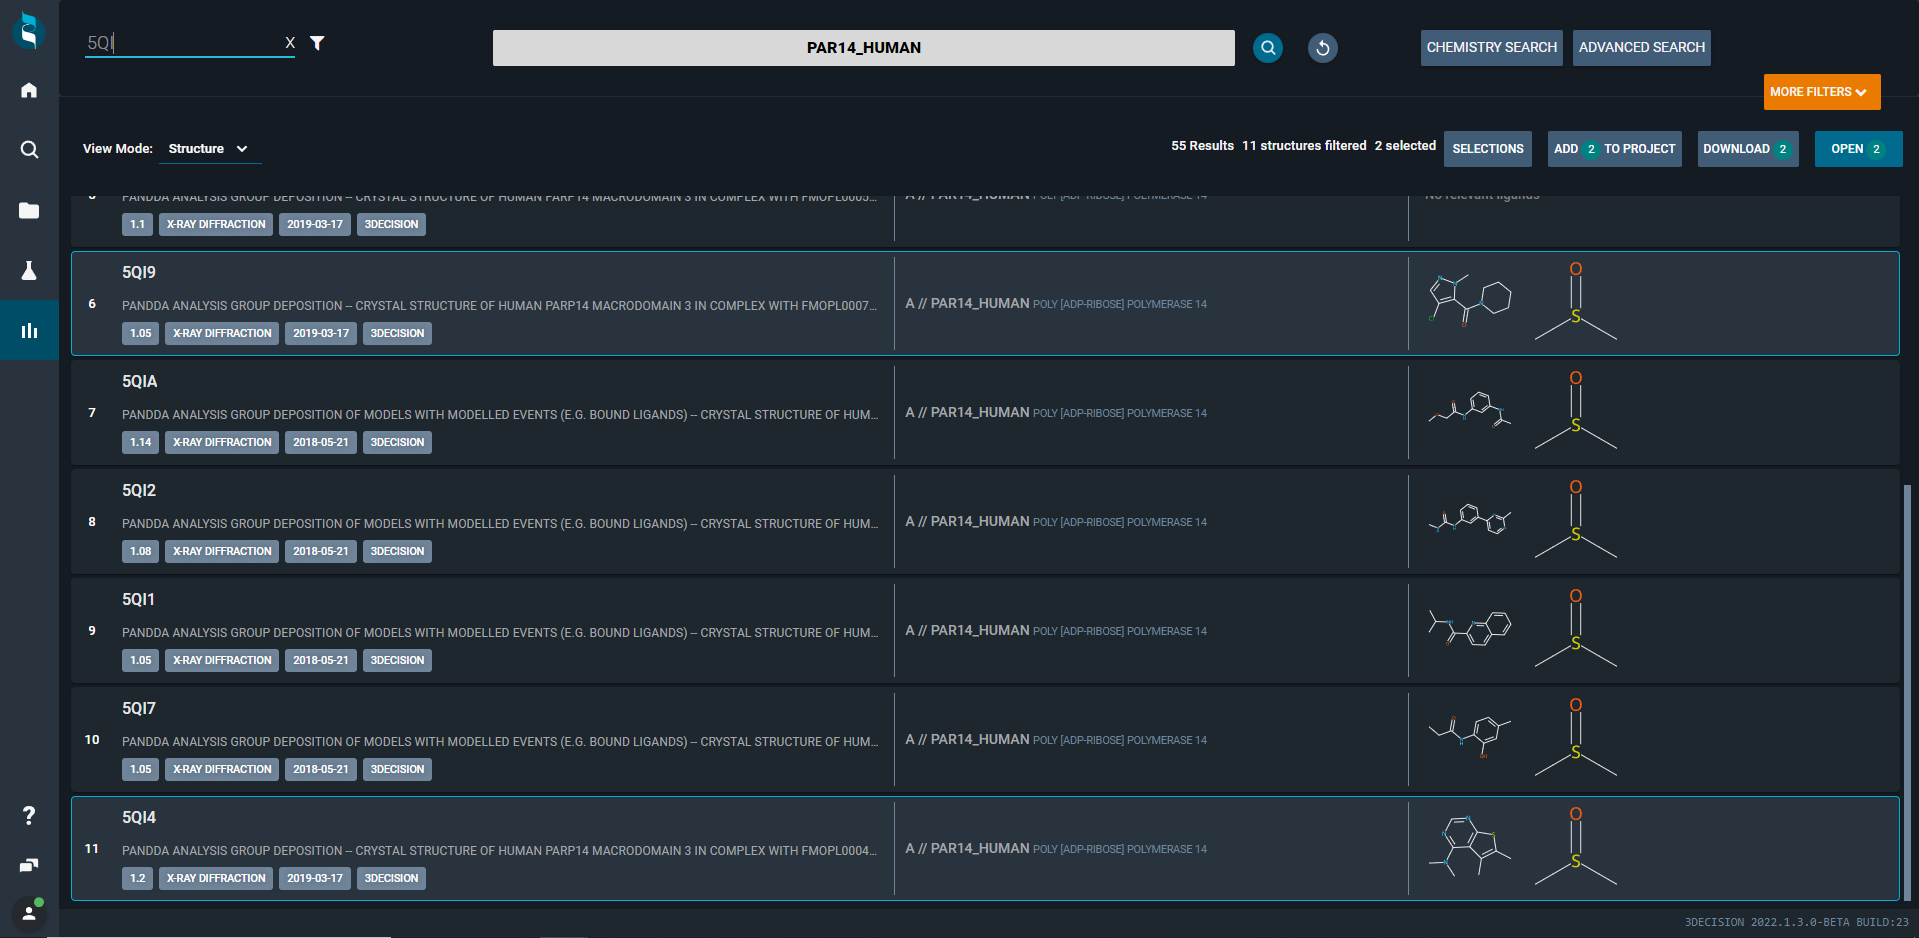
Next, click on the blue OPEN button (top right) to open and visualize these structures in the 3decision workspace.
¶ Loading electron density maps
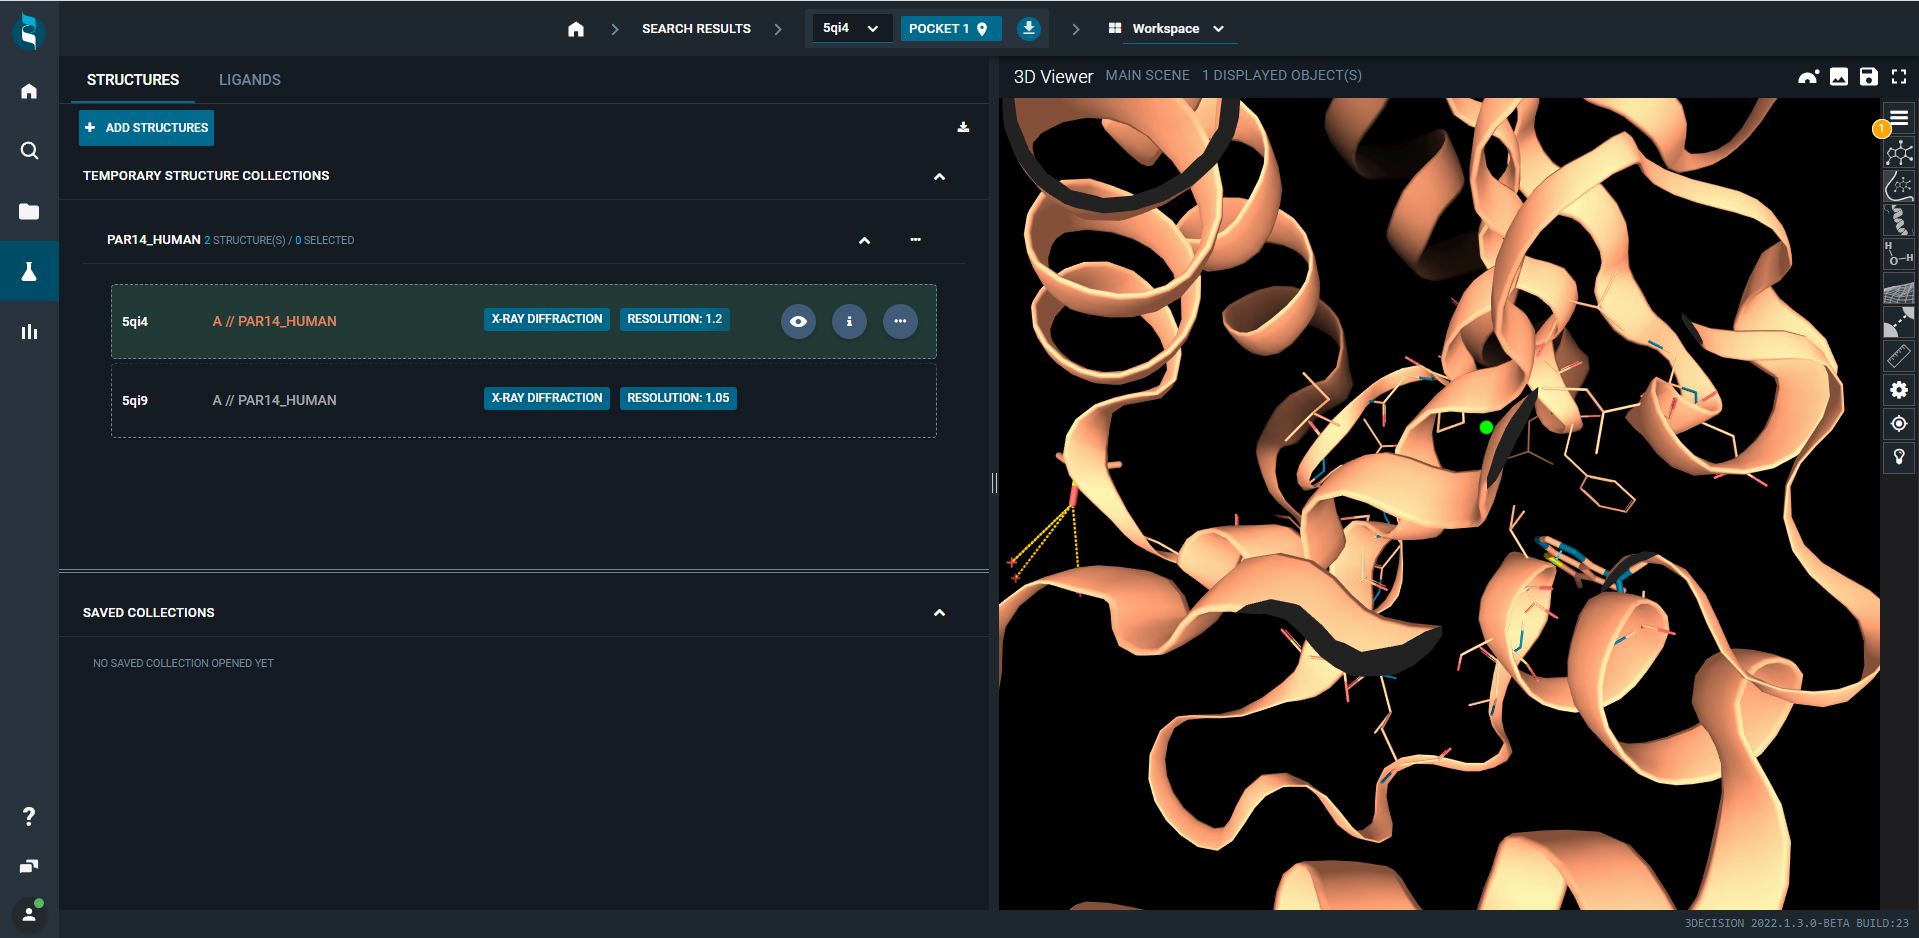
In the STRUCTURES tab of the workspace (on the left), you see the list of the structures that you just opened. The first structure is shown by default. When you go with your mouse over the first entry, you will see three icons appear on the right: an eye, information and a three-dot icon (...).
Click on the three-dot icon (...) to open up a list of actions you can carry out on that particular structure.
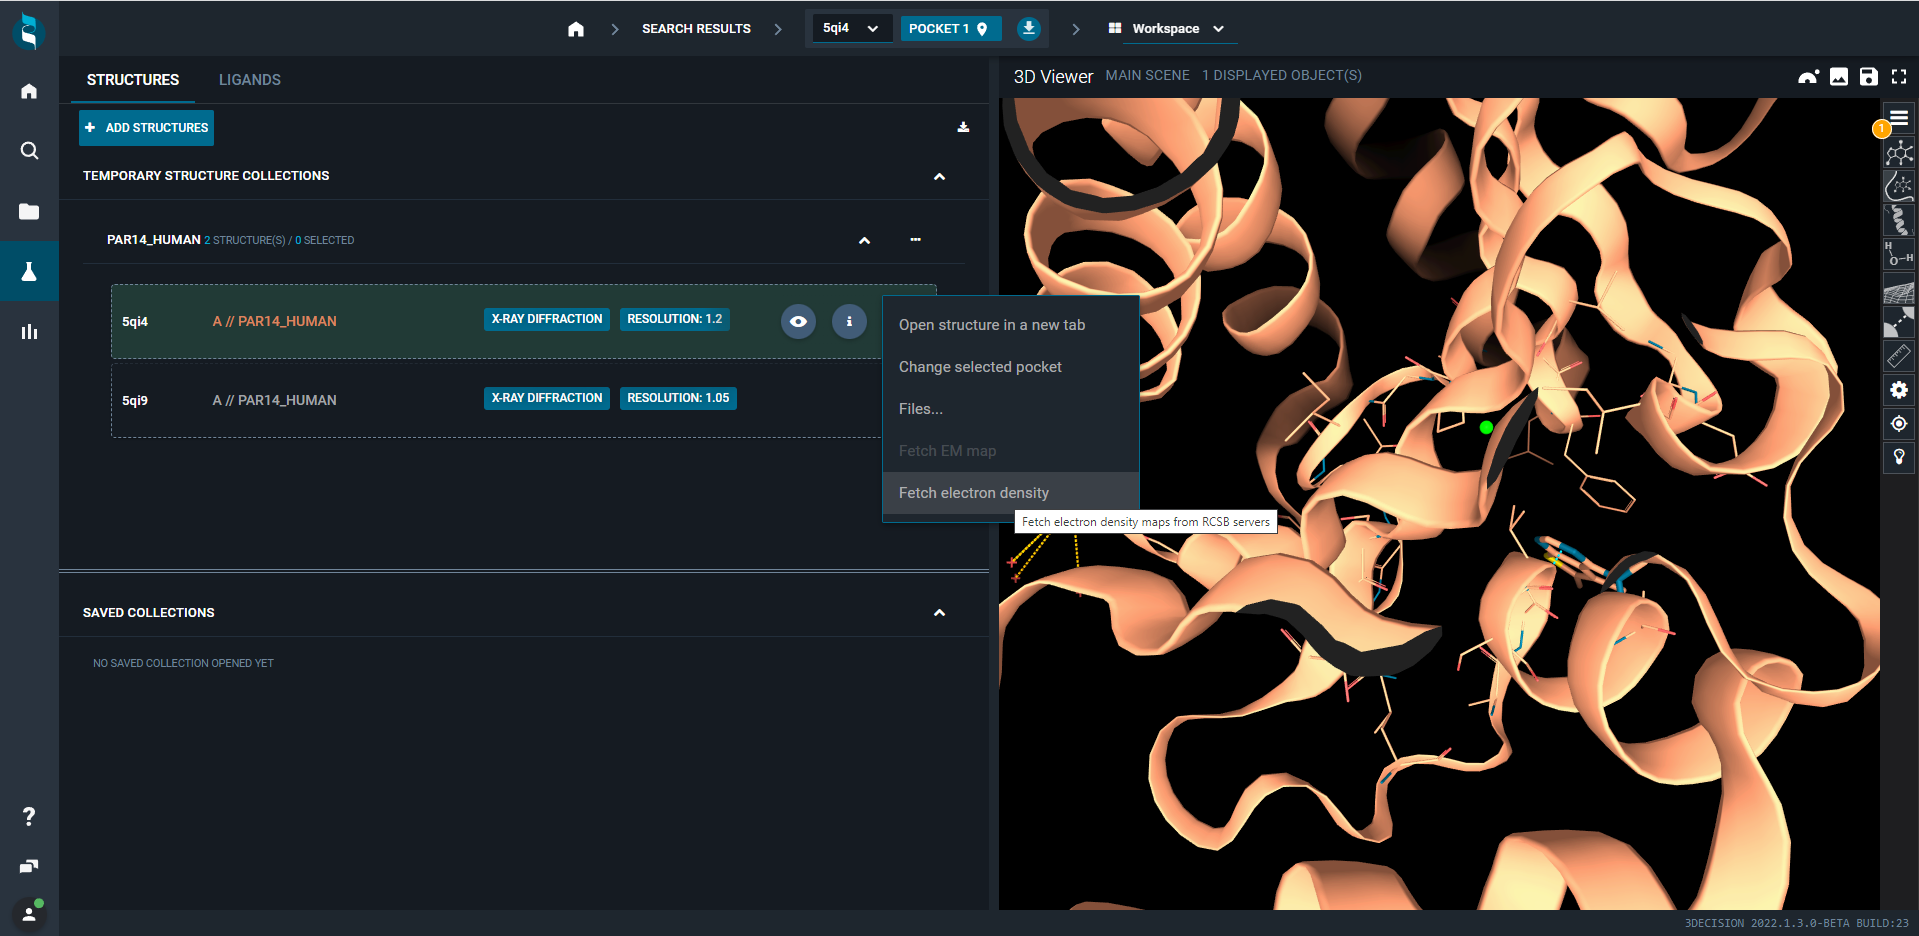
Select Fetch electron density. This will open the following pop-up.
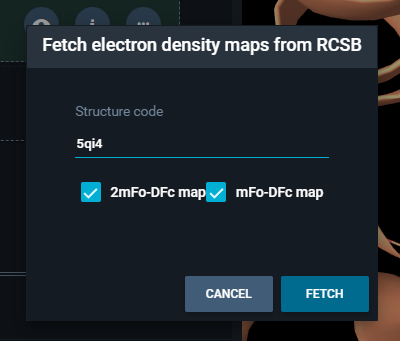
Here you can select the type of maps you would like to retrieve. For this example, please also check the difference map (which is deactivated by default). Click FETCH to upload the maps into your 3D Viewer.
¶ Handling display
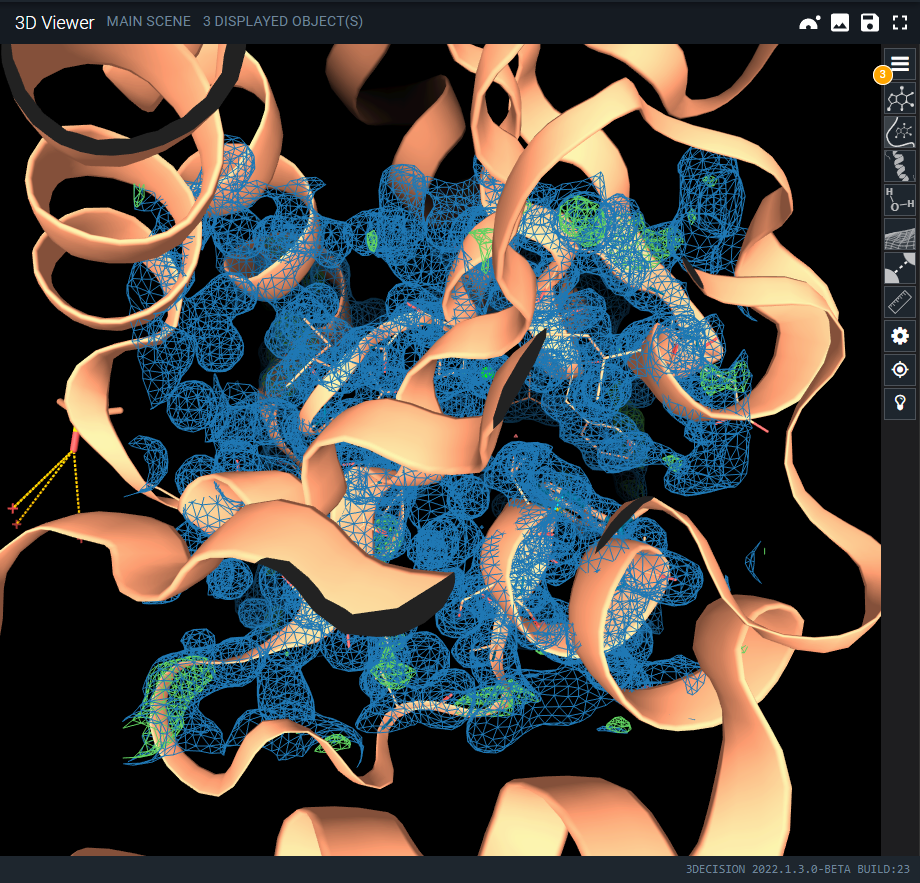
By default you will see your new 2Fo-Fc map in blue mesh at isovalue 1. The difference map will be shown the same way as in COOT, with red and green blobs depending on the difference. You can right-click and drag the screen to move to a different location on the structure. The map will adjust to your viewpoint accordingly.
If you click on the top-right menu icon of the 3D-viewer (the hamburger icon), you will open all objects loaded in the 3D viewer.
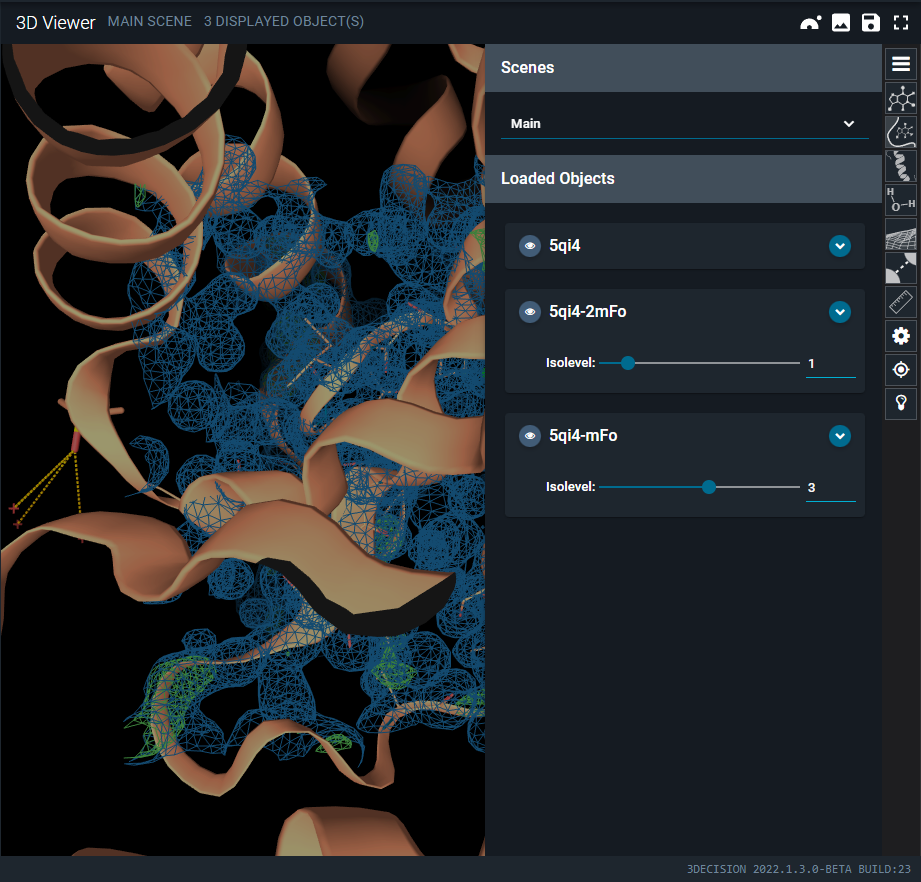
You can now adjust the isovalues of your maps using the slider.
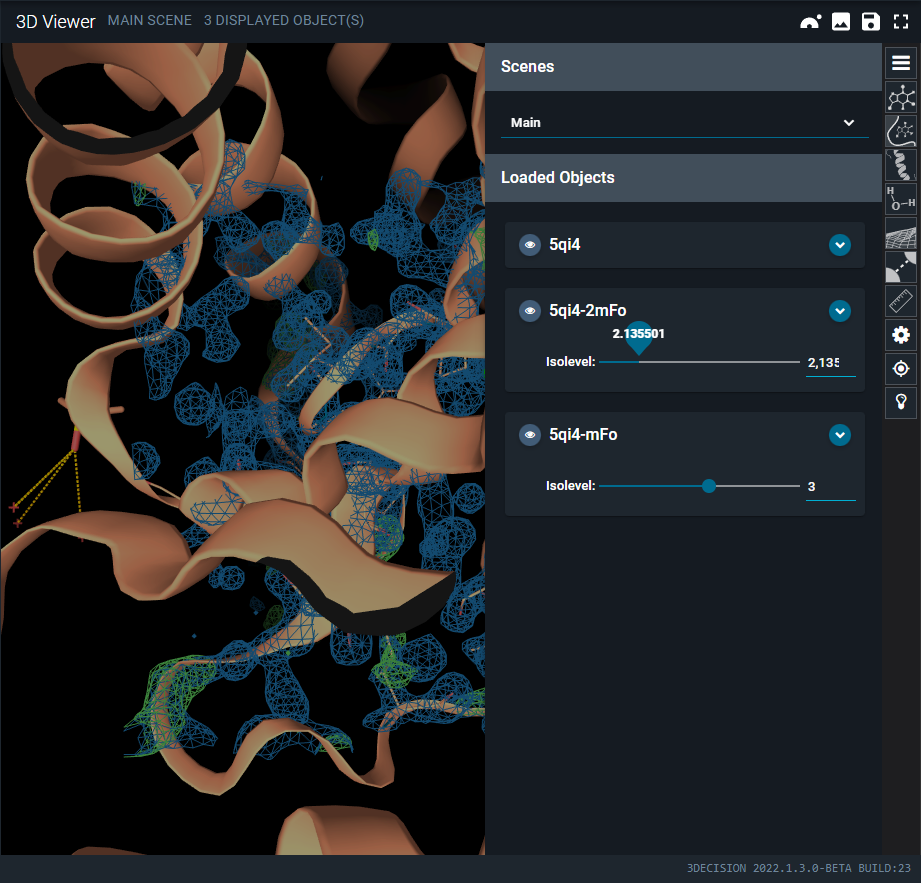
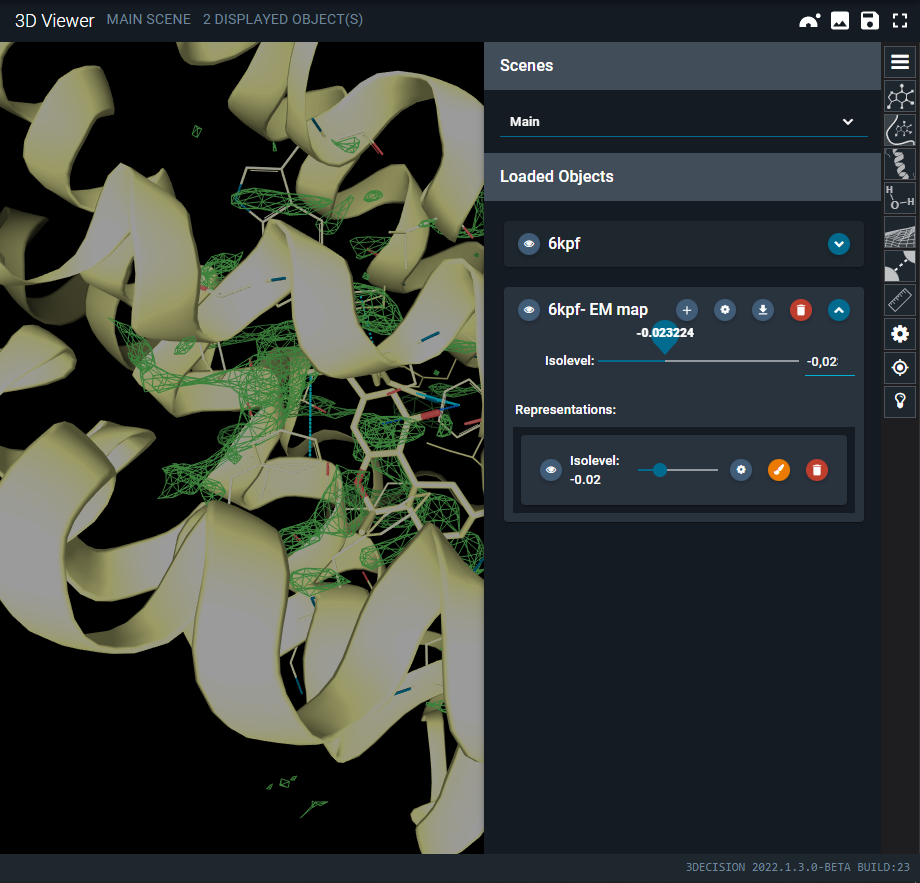
If you uncollapse one map (click on the blue down arrow of the map representation), you can modify the representation and color of the map. So you can adjust if it is a mesh or a solid surface (cog icon), the color (brush icon) and the isovalue.
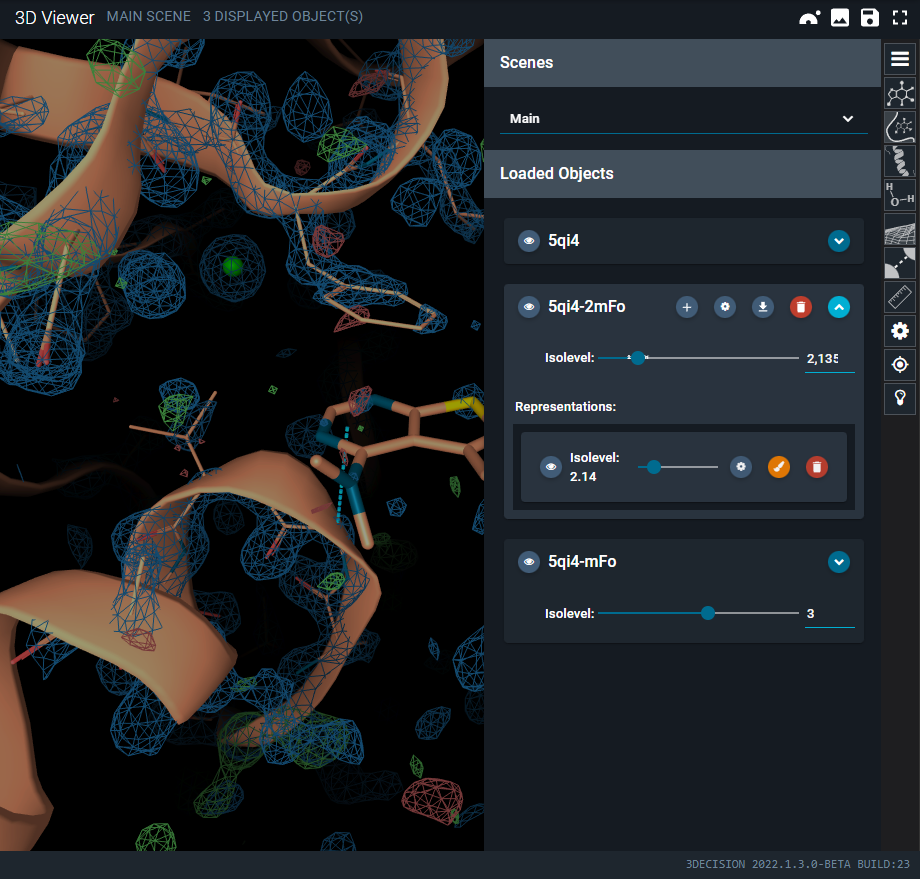
¶ Aligning structures & maps
Now let's complexify things a little bit, and add a second structure to the scene. Click on the eye icon of the second structure in the workspace. This will superpose the structure locally and display it in the 3D Viewer.
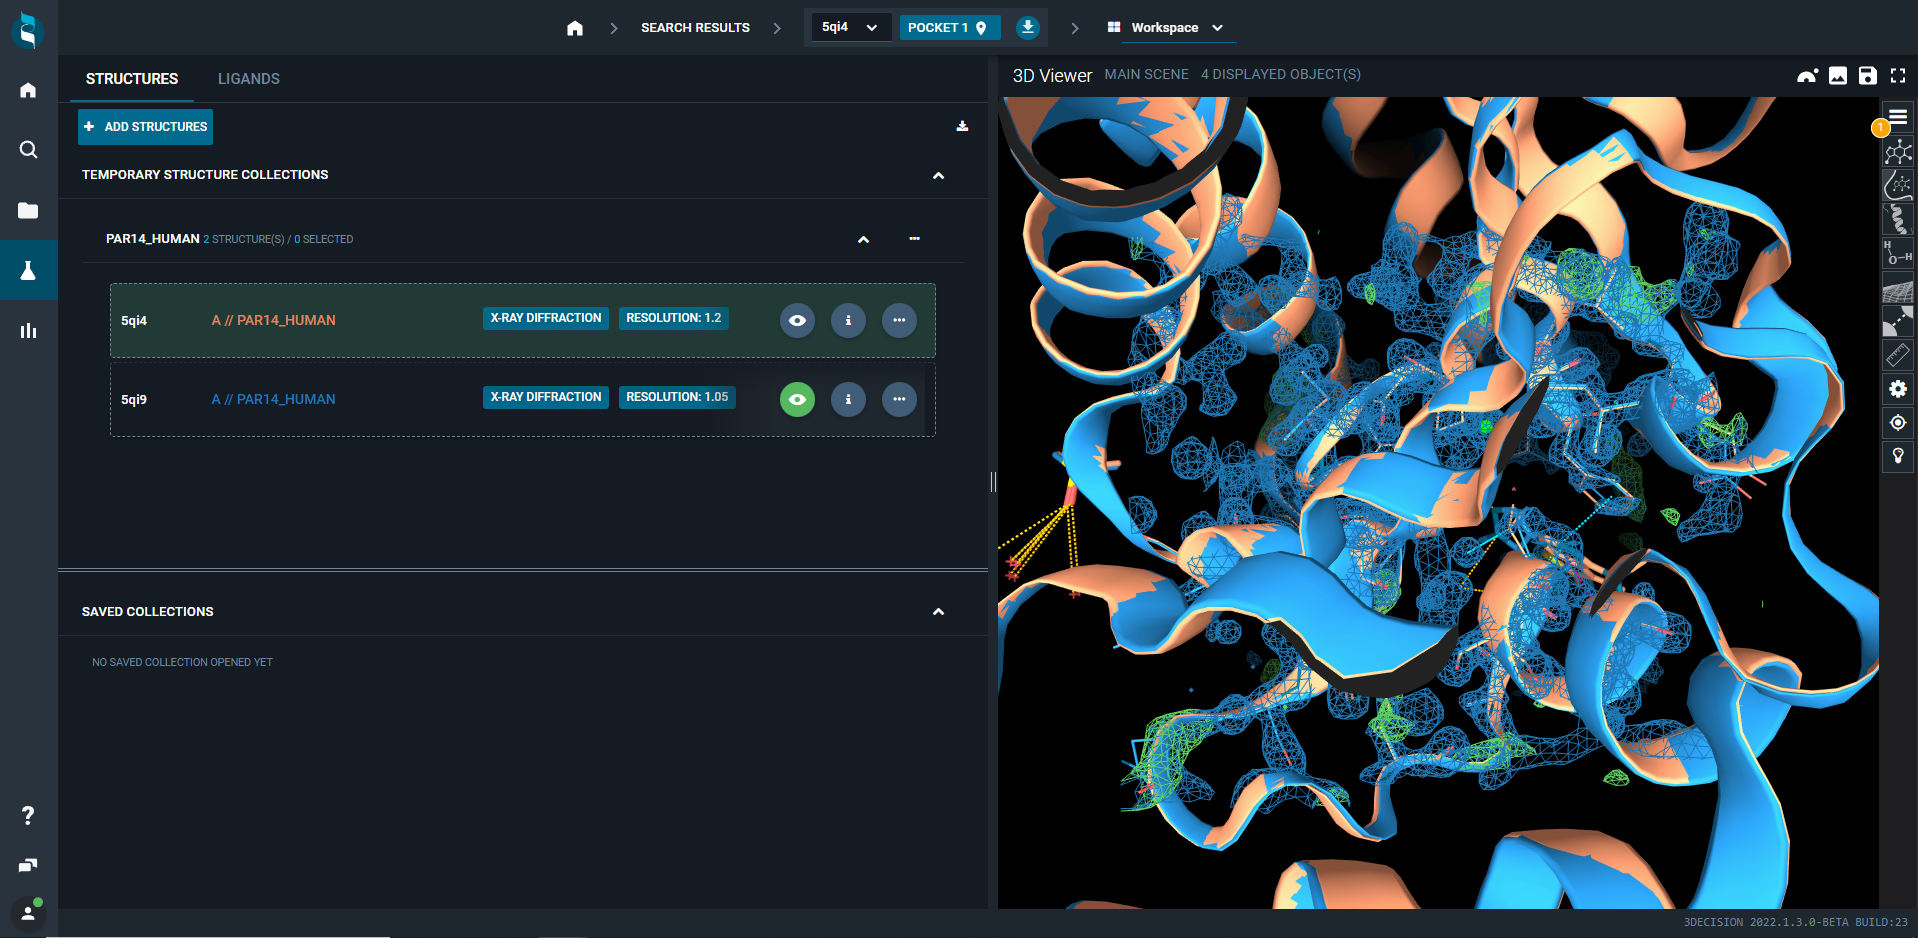
Here again, you can go through the three-dot icon (...) to add the electron density map of the second structure. Follow the previously described steps to do so.
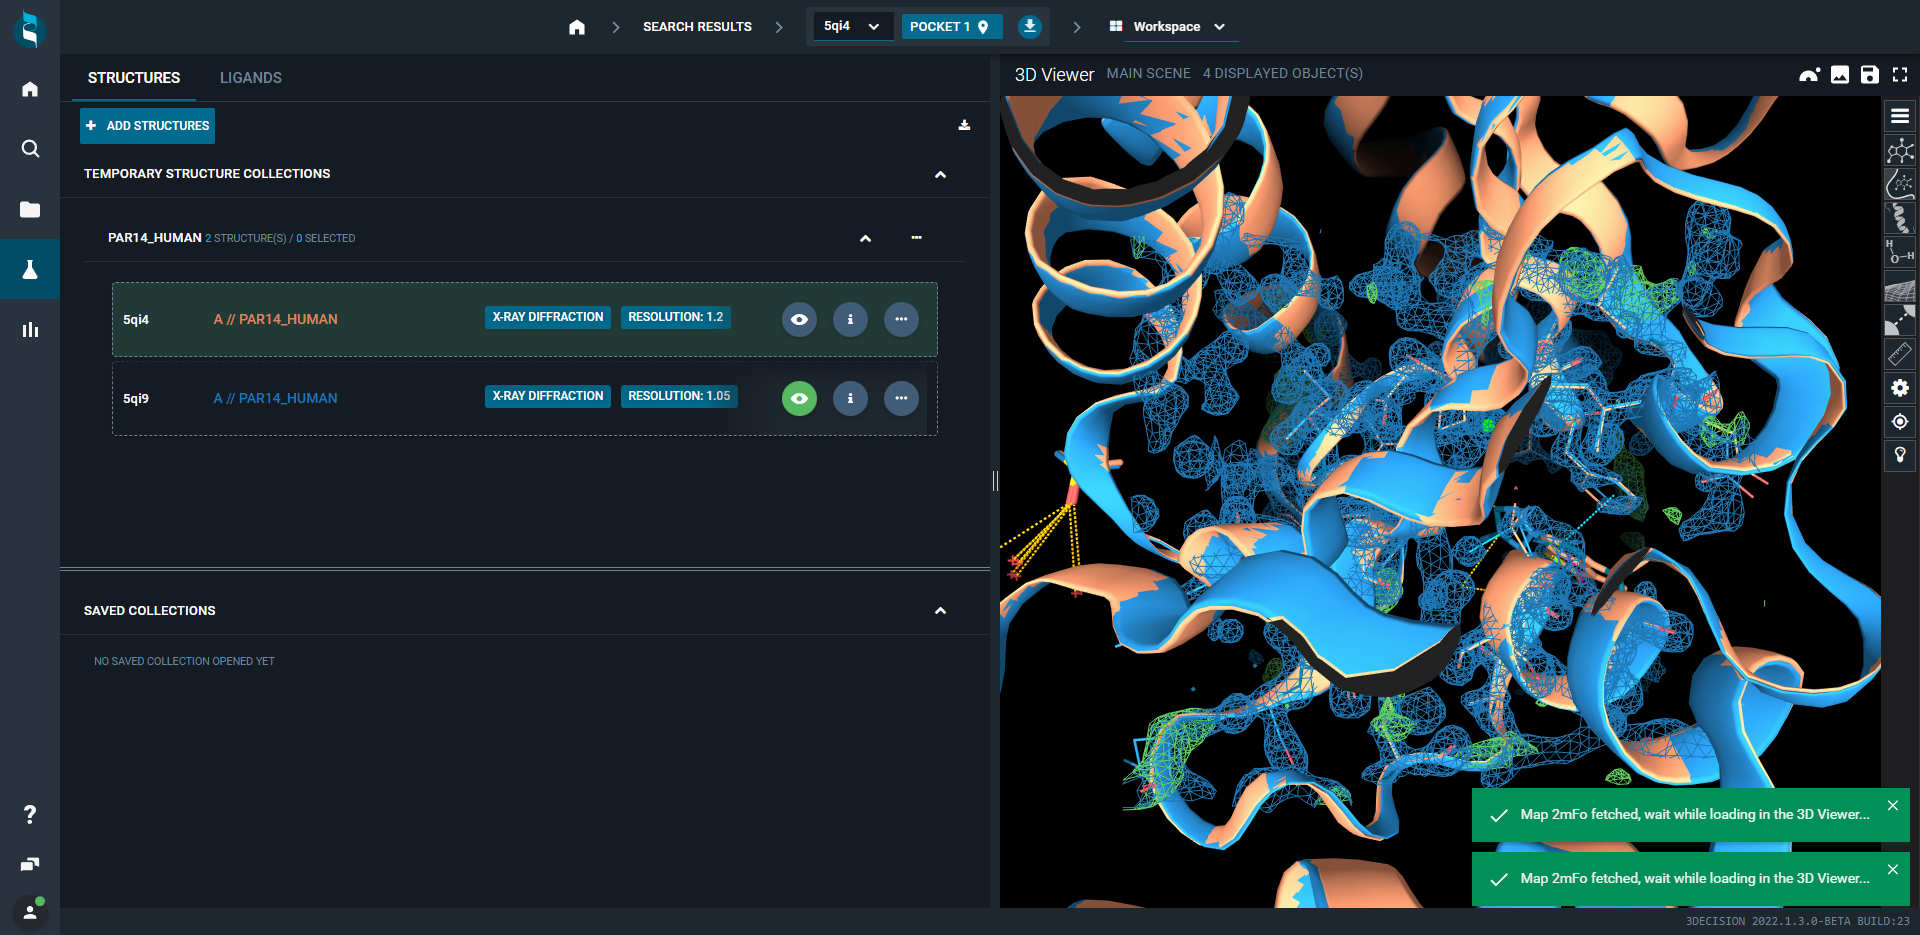
Above, you can see both superposed structures, but also two superposed electron density maps. Both show up as blue mesh, which is not ideal here.
So let's change the colour of the second map.
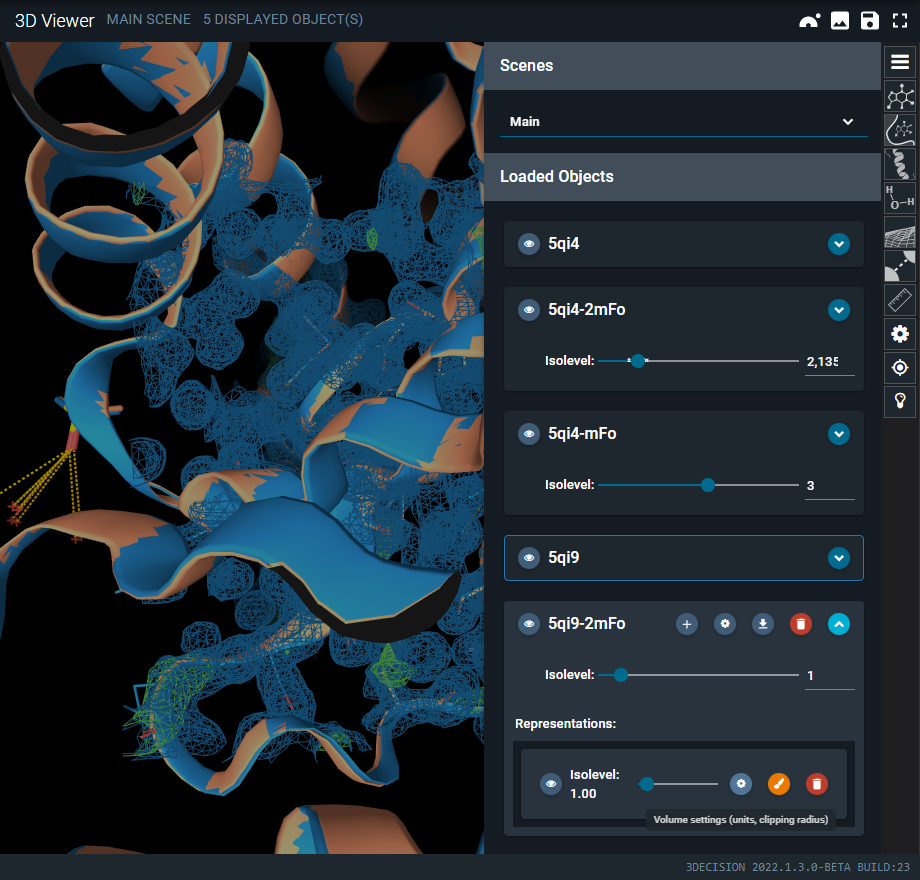
Open the 3D Viewer menu, locate the new 2mFo map and unfold the card by clicking on the blue unfold icon on the right of the card.
Then click on the brush icon to open up a color palette you can choose a color from:
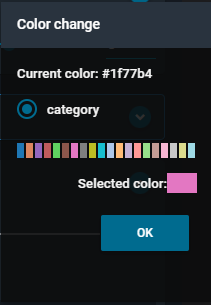
Click OK to change the colour.
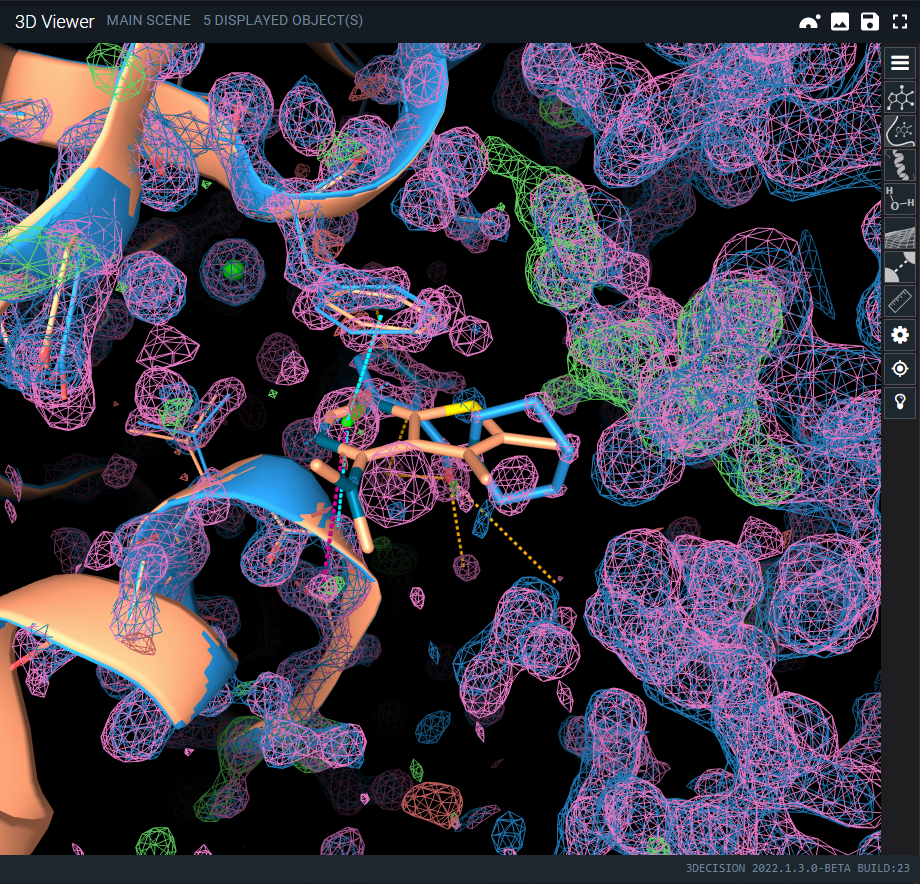
Finally, you have two superimposed structures with two superimposed electron density maps.
¶ Adding line representation
If you want to add the line representation for the full structure (to see all atoms), you can achieve that by going to the menu icon of the 3D viewer. On your structure of interest, for instance, 5QI4, click on the + icon and select Lines as a representation. This will add line representations for the full structure.
¶ Tutorial for Cryo-EM structures
¶ Loading electron density maps
Open your workspace or a set of structures of interest. For this example, I used 6KPF structure.
In the STRUCTURES tab of the workspace (on the left), you see the structure that you just opened. When you go with your mouse over the entry, you will see three icons appear on the right, an eye, information and a three-dot icon (...).
Click on the three-dot icon (...) for the list of actions you can carry out on that particular structure.
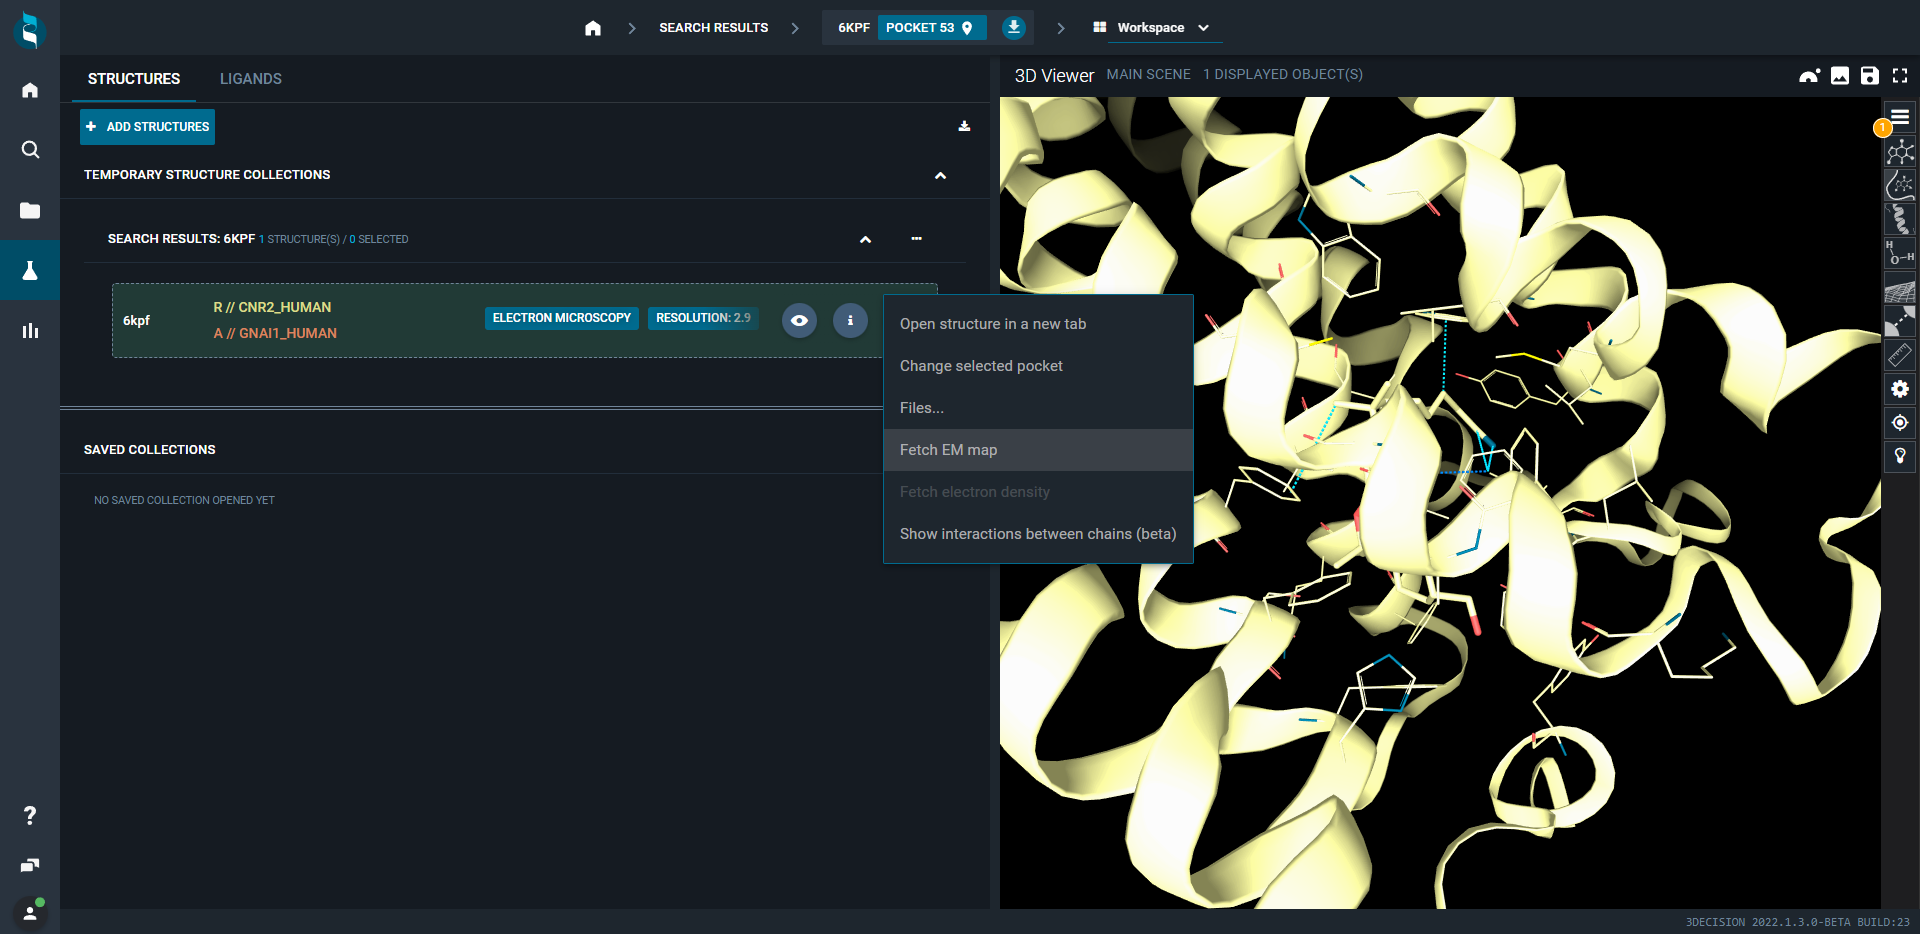
Select Fetch EM map. This will directly load the electron density map.
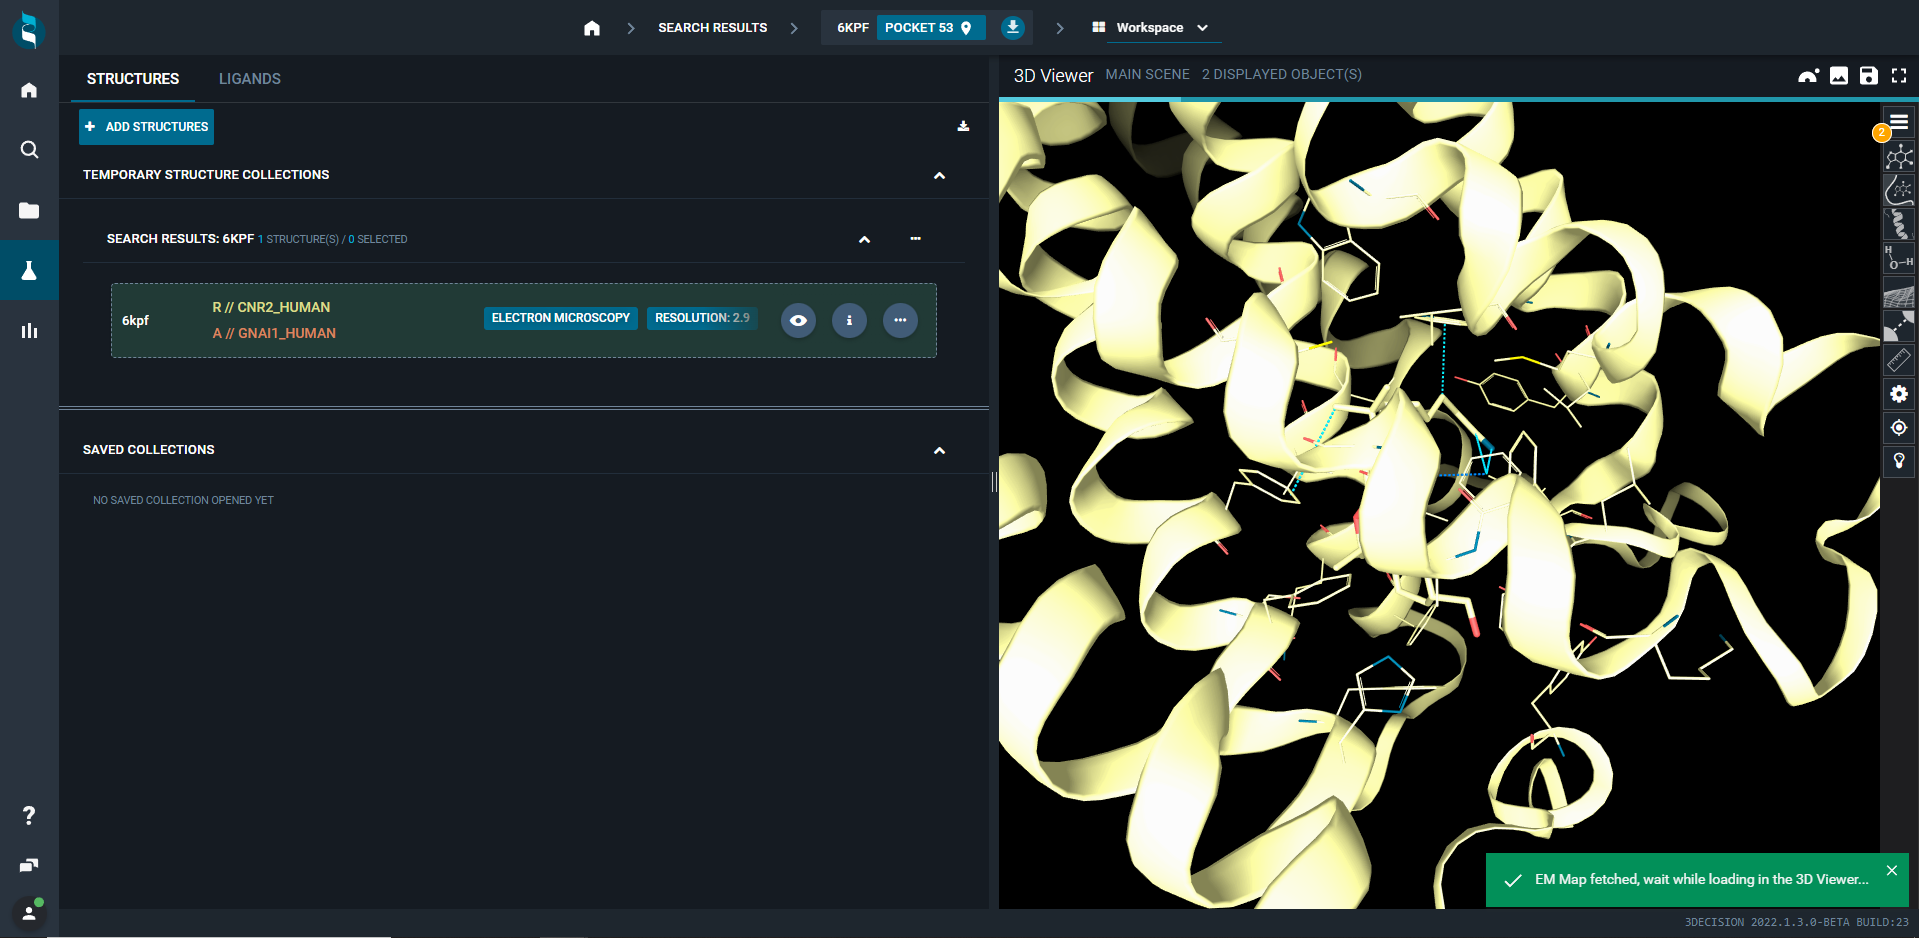
By default, CryoEM map is shown in green.
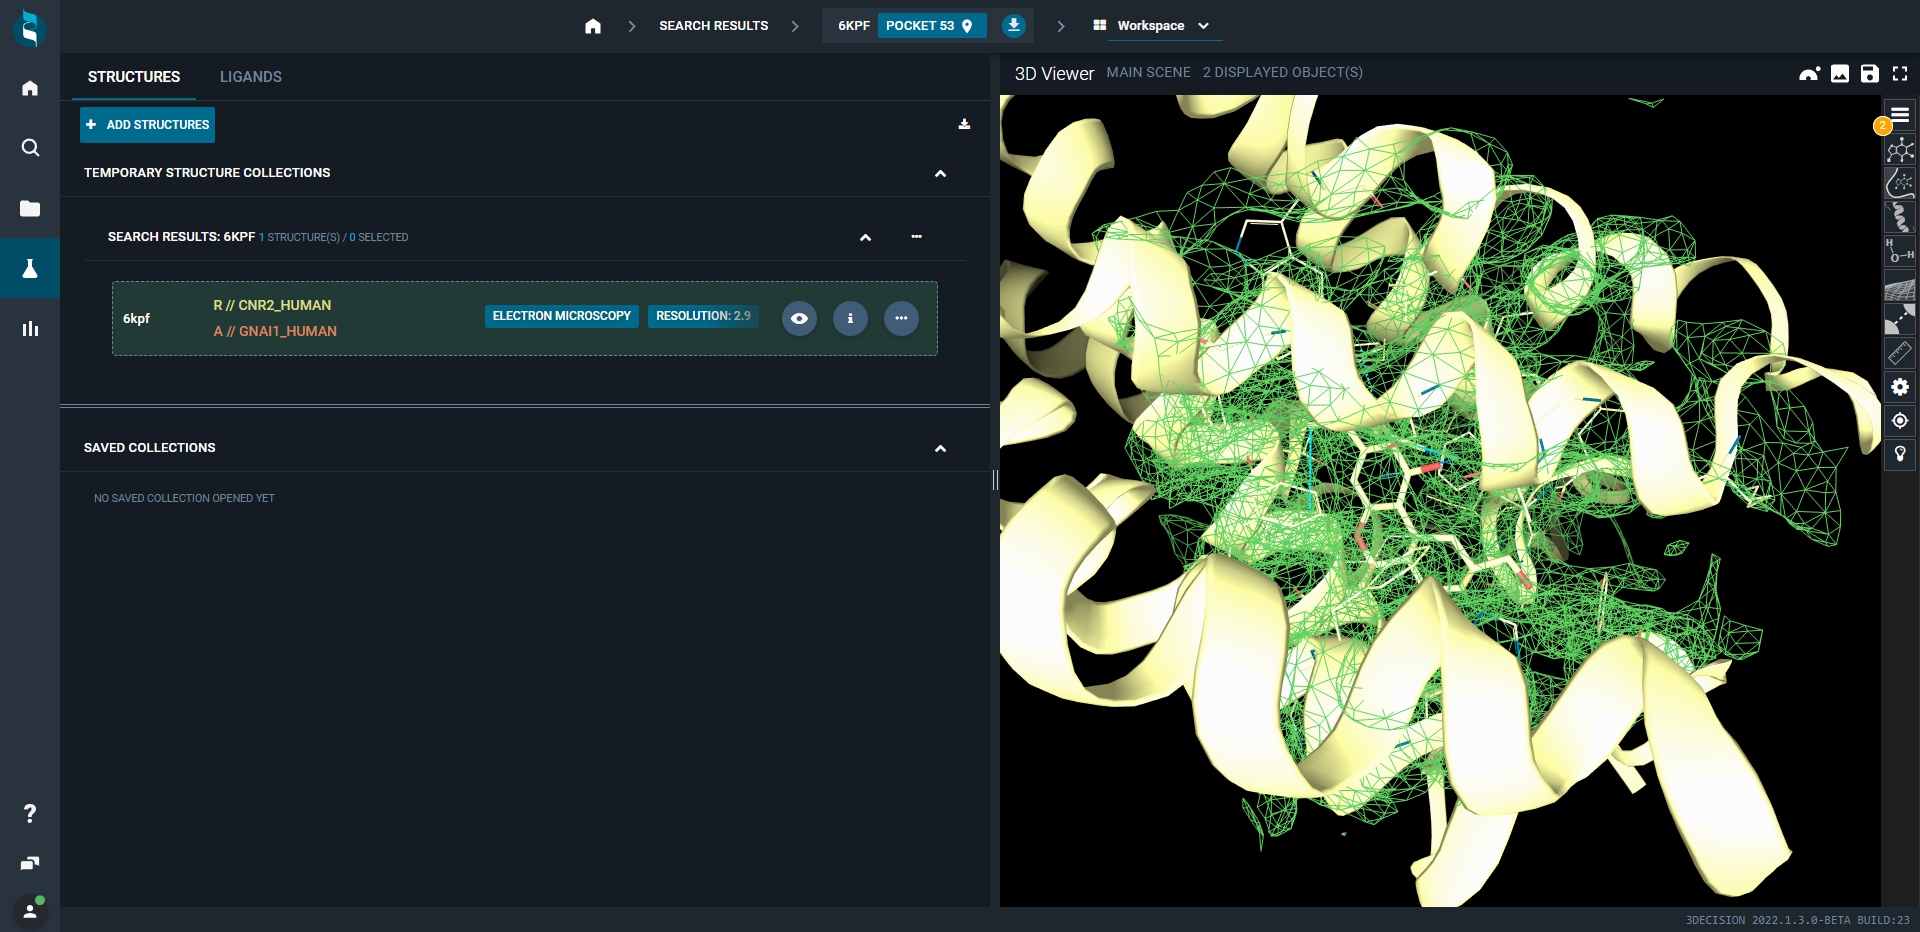
¶ Handling display
You can adjust the isovalue of your map using the slider.
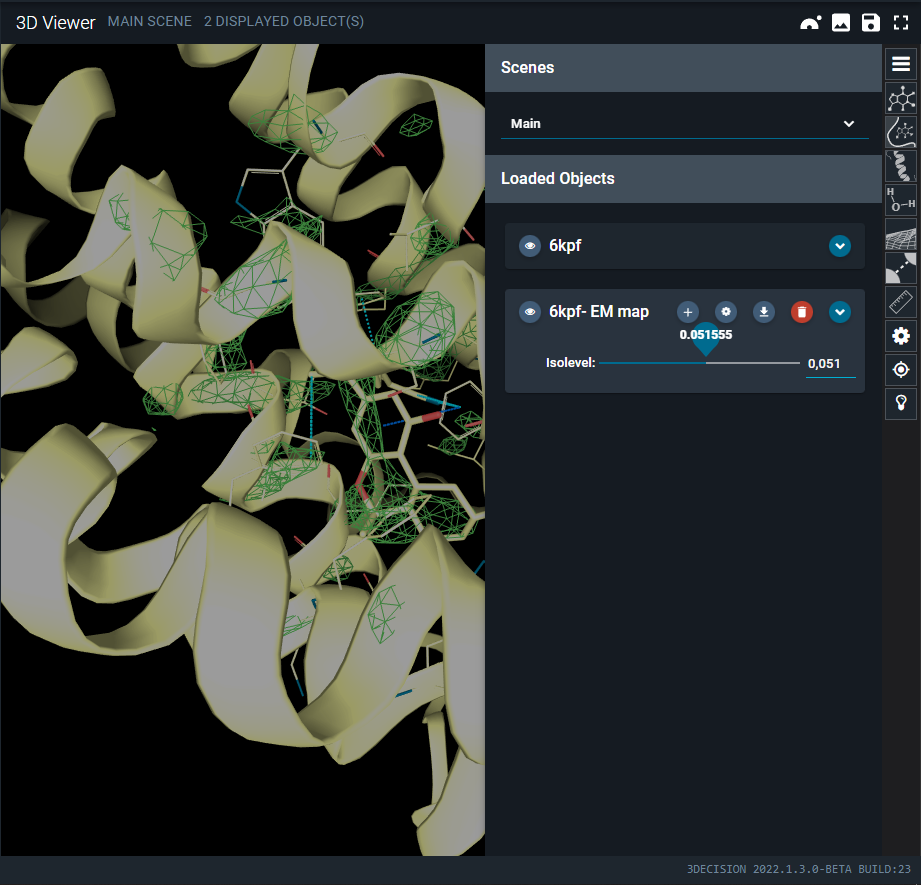
If you uncollapse one map (click on the blue down arrow of the map representation), you can modify the representation and color of the map. So you can adjust if it is a mesh or a solid surface (cog icon), the color (brush icon) and the isovalue.
¶ Aligning structures & maps
You can align structures & maps, in the same way as explained for crystallographic structures. Just change color of the second map for easier analysis.