In this tutorials collection, you will see how to:
- Display electron density maps for public domain structures (both X-ray and Cryo-EM structures);
- Edit representation settings;
- Compare multiple electron density maps;
- Handle electron density maps for proprietary structures.
For a comprehensive overview of electron density maps in 3decision, you can refer to this page of the user documentation.
¶ Public Crystal Structures
¶ 1. Open structure in the Workspace
- Run a basic search using the PDB code:
5QI4. You will have one structure in the search result. - Click on the blue "OPEN" button (top right) to open and visualize the structure in the 3decision Workspace.
¶ 2. Load the x-ray electron density maps
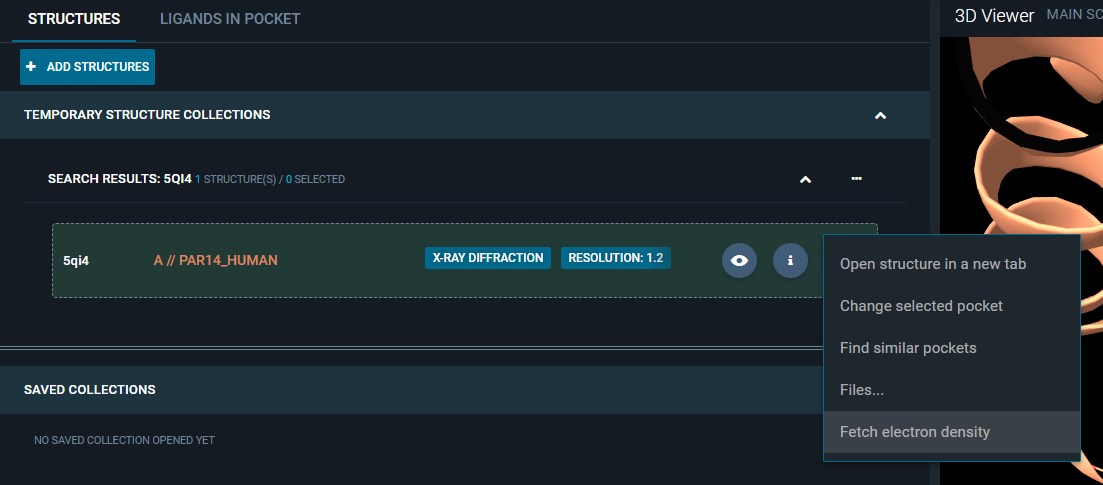
- Hover your mouse over the structure card on the left-side of the page, and click on the three-dot icon that appears on the right. This opens the structure action menu.
- Select
Fetch electron densityfrom the menu. This will open the following pop-up.
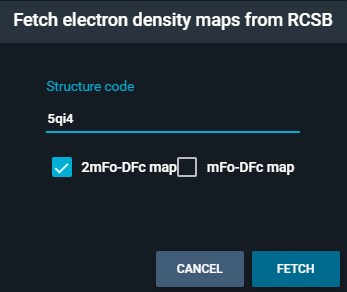
- Toggle on both maps, and click on the blue button "FETCH"
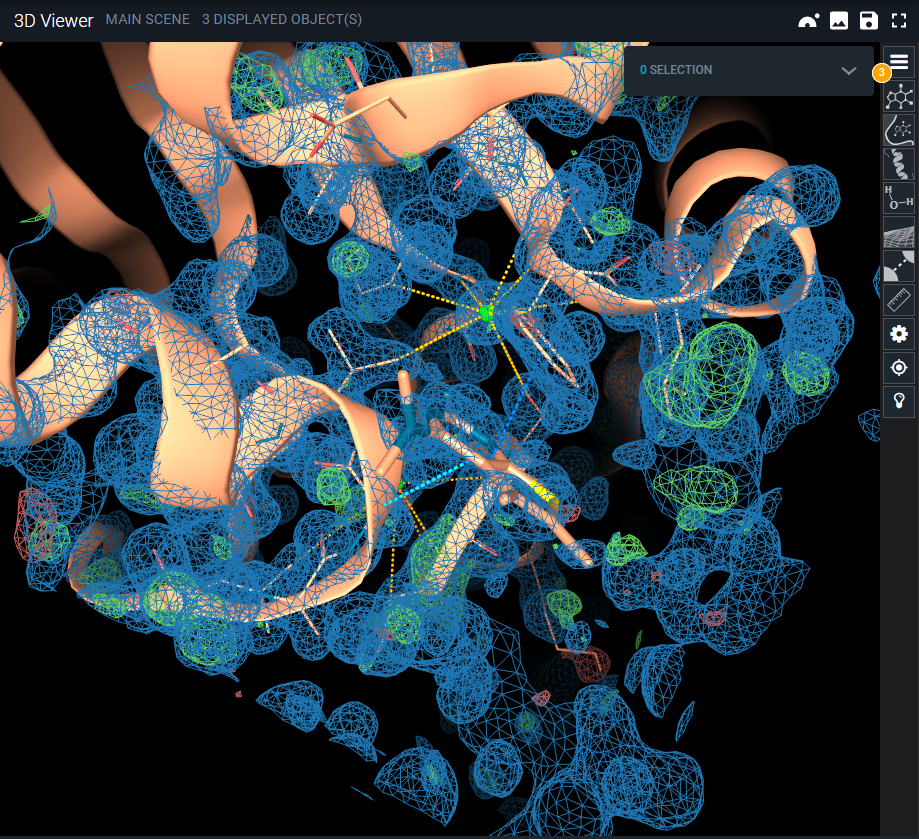
- The density map and the difference maps are uploaded into the 3D Viewer:
- the 2Fo-Fc map is represented as blue mesh at isovalue 1;
- the Fo-Fc map is shown with red and green blobs at isovalue ±3.
- Right-click on the structure and drag the mouse: you move to a different location on the structure and the map will adjust to your viewpoint accordingly.
Representation settings of the maps, such as isolevel regulation, volume settings, and coloring can be edited through the Objects Panel (top-button of the 3D Viewer menu, on the right), as described in the dedicated section Edit representation options.
¶ Public Cryo-EM Structures
¶ 1. Open structure in the Workspace
- Run a basic search for the PDB code:
6KPF. You will have one structure in the search result. - Click on the blue "OPEN" button (top right) to open and visualize the structure in the 3decision Workspace.
¶ 2. Load the Cryo-EM electron density map
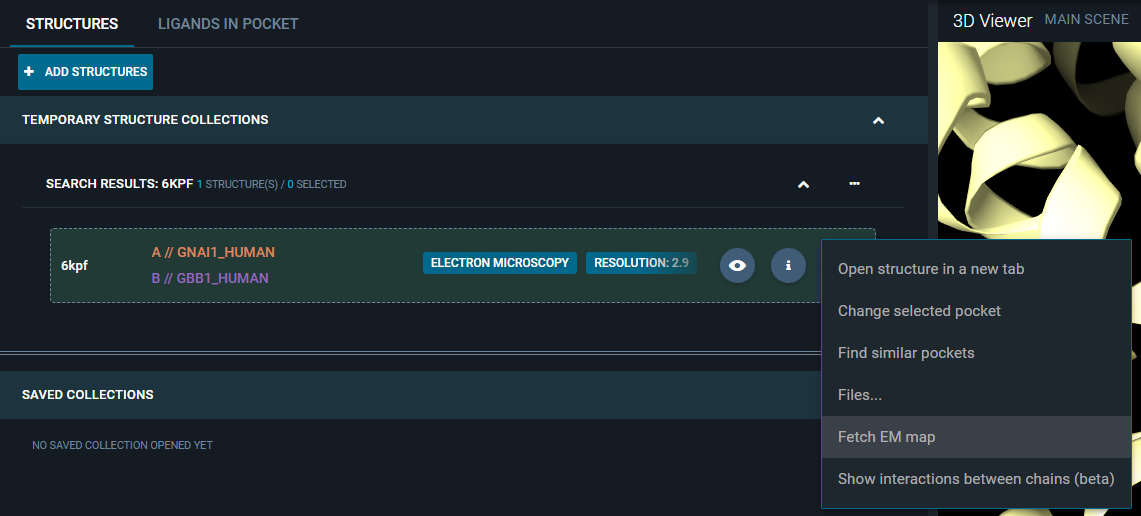
- Hover your mouse over the structure card on the left-side of the page, and click on the three-dot icon that appears on the right. This opens the structure action menu.
- Select
Fetch EM mapfrom the menu.
- Fetching the map can take a couple of seconds depending on the size of the file (see the status of the blue progress bar on the bottom right). When ready, the map is loaded in the 3DViewer and is represented by default in green mesh.
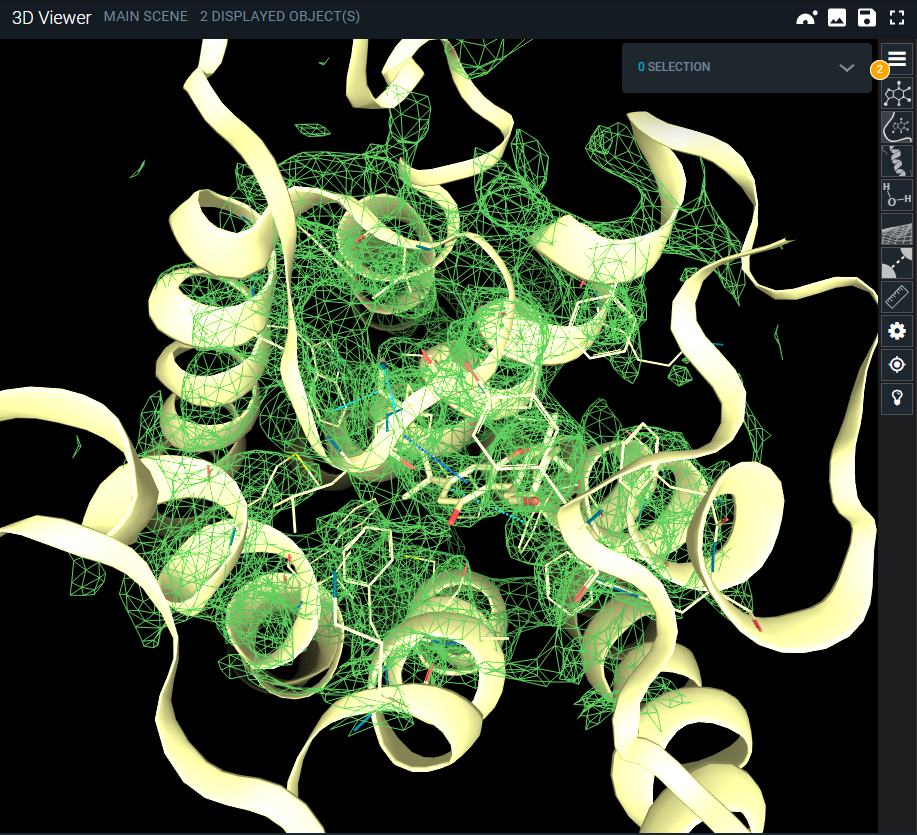
Representation settings of the map, such as isolevel regulation, volume settings, and coloring can be edited through the Objects Panel (top-button of the 3D Viewer menu, on the right), as described in the dedicated section Edit representation options.
¶ Edit representation options
In this section of the tutorial, you will learn how to edit the representation options of an electron density map loaded in the workspace.
¶ Change the isolevel
- Open one structure in the Workspace and load an electron density map. For this example, you can use the workflow desribed in the previous section (Cryo-EM tutorial).
- Click on the top-button of the 3DViewer menu, on the right ("hamburger" icon).
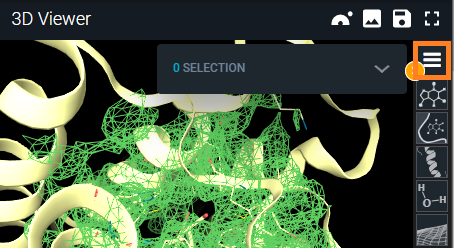
- This opens the Objects Panel, that lists all objects loaded in the 3D Viewer, including the electron density map.
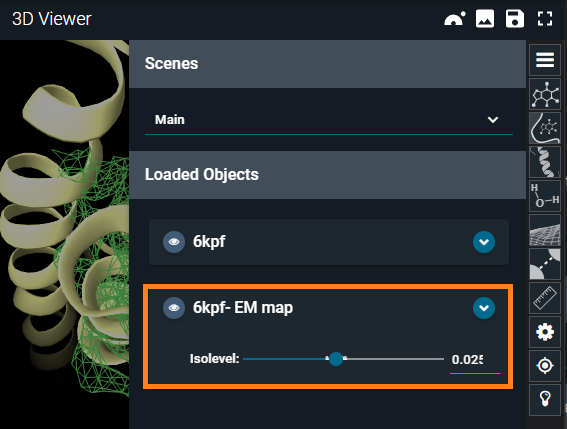
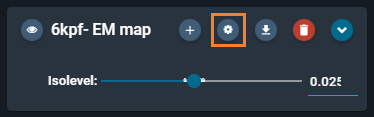
- Hover your mouse over the electron density map card
6kpf-EM map, and click on the cogwheel icon (Volume Settings) that appears.
- From the "Volume Settings" Menu, toggle on "Sigma units" and adjust the Isolevel to the value 6.
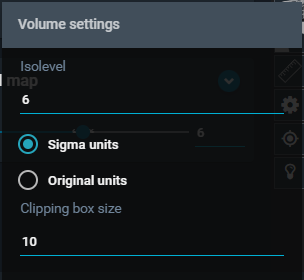
- Click anywhere outside the menu to close it. Click again on the "hamburger" icon to close the object panel.
You can see in the 3D Viewer that the map is updated accordingly to the new unit and value.
¶ Change the color
- Click again on the "hamburger button" to open the Objects Panel.
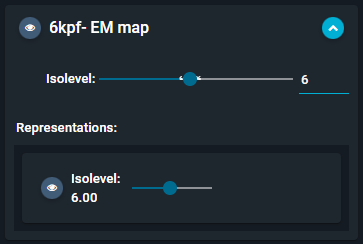
- Click on the blue arrow at the right of the
6kpf-EM mapelectron density map card.
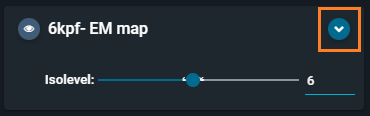
- This unfolds the "Representations" submenu.
- Hover with the mouse on this section, and click on the orange "brush" button that appears.
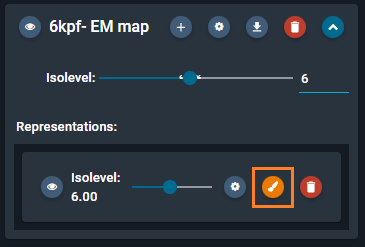
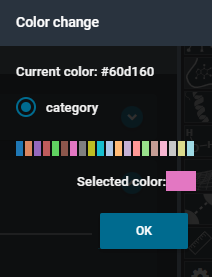
- This opens the color options. Select the color pink, then press the blue button "OK".
- Click outside the Objects Panel to close it.
You can see in the 3D Viewer that the map is now colered in pink.
¶ Compare electron density maps
In this other tutorial, we will show how to compare and overlay electron desity maps. Note that you can compare maps from any structure (public or private - crystal or EM).
¶ 1. Overlay structures in the Workspace
- Run a basic search for the PDB code
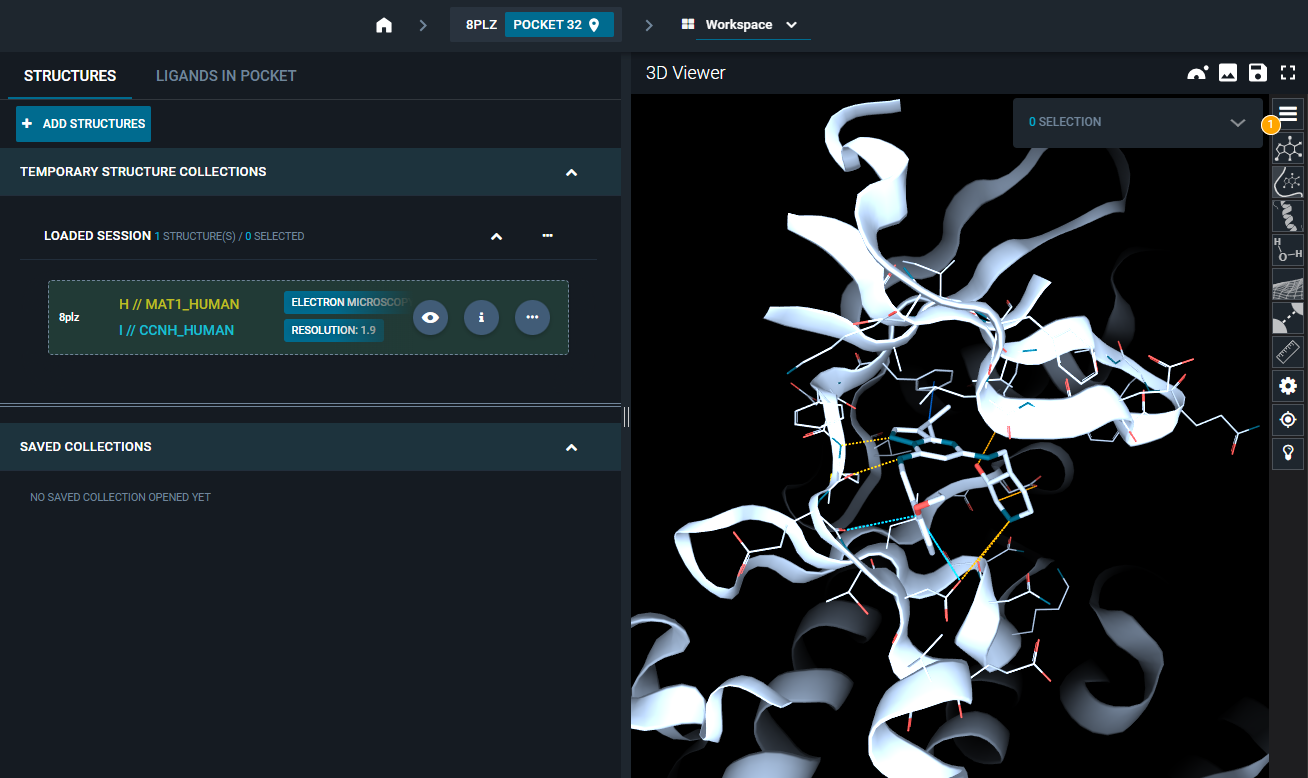
8PLZ. - From the results page, click on the blue "OPEN" button at the top-right of the page to open the structure in the workspace.
- The workspace is automatically opened and the structure is loaded in the 3D Viewer, focusing on the ATP-binding site (as in the picture below).
- From the workspace, click on the "ADD STRUCTURES" button on the top-left of the page, to add the second structure.
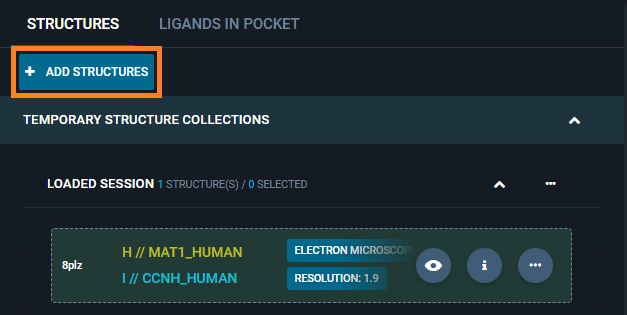
- From the menu that appears, select the option
From code.... This will open the following pop-up:
-
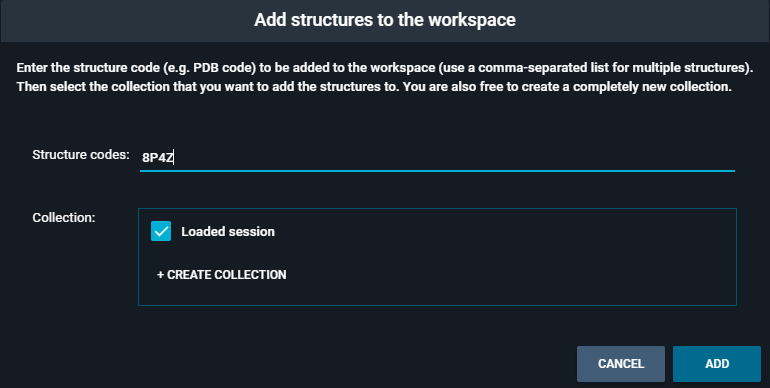
Type the PDB code
8P4Zin the "Structure codes" section, and toggle the "Loaded session" checkbox in "Collection". Then, click the blue button "ADD". -
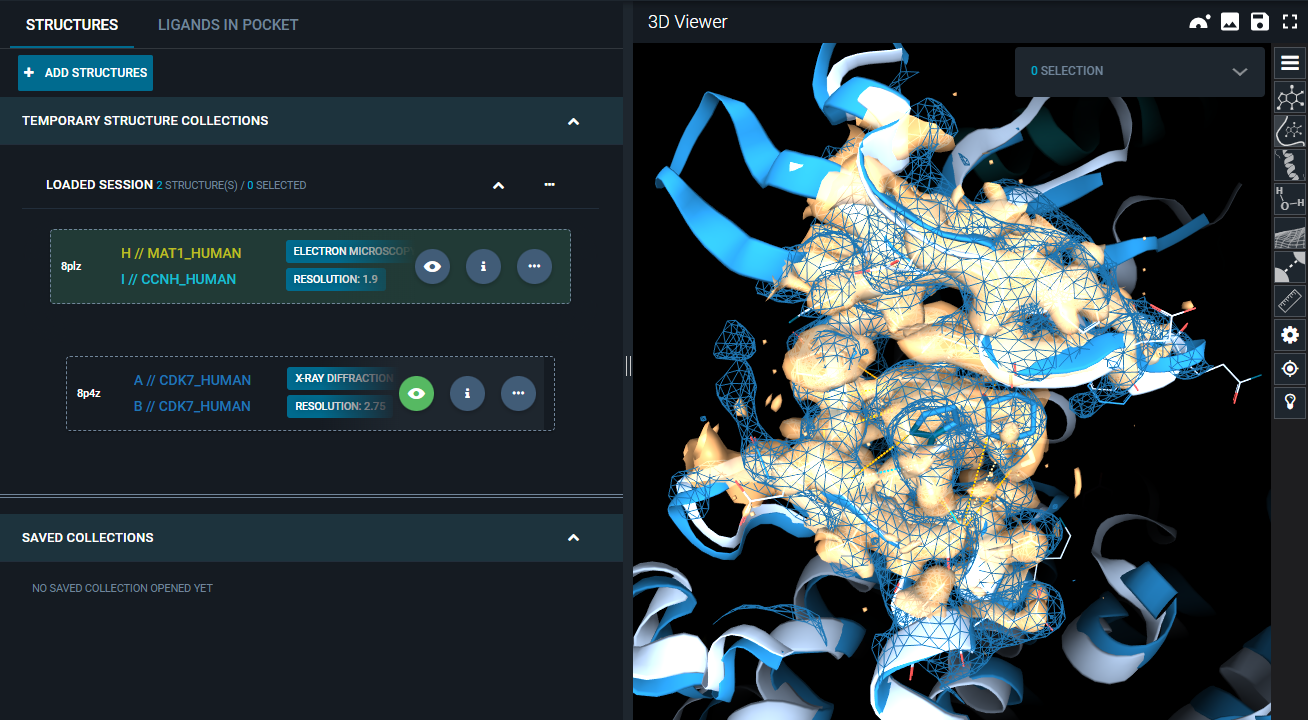
The second structure is added to the workspace. Hover with the mouse on the structure card of this second structure, and click on the "eye" icon that appears.
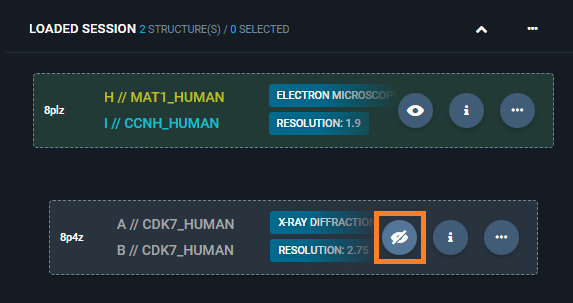
This will superpose the second structure on the reference pocket and display it in the 3D Viewer.
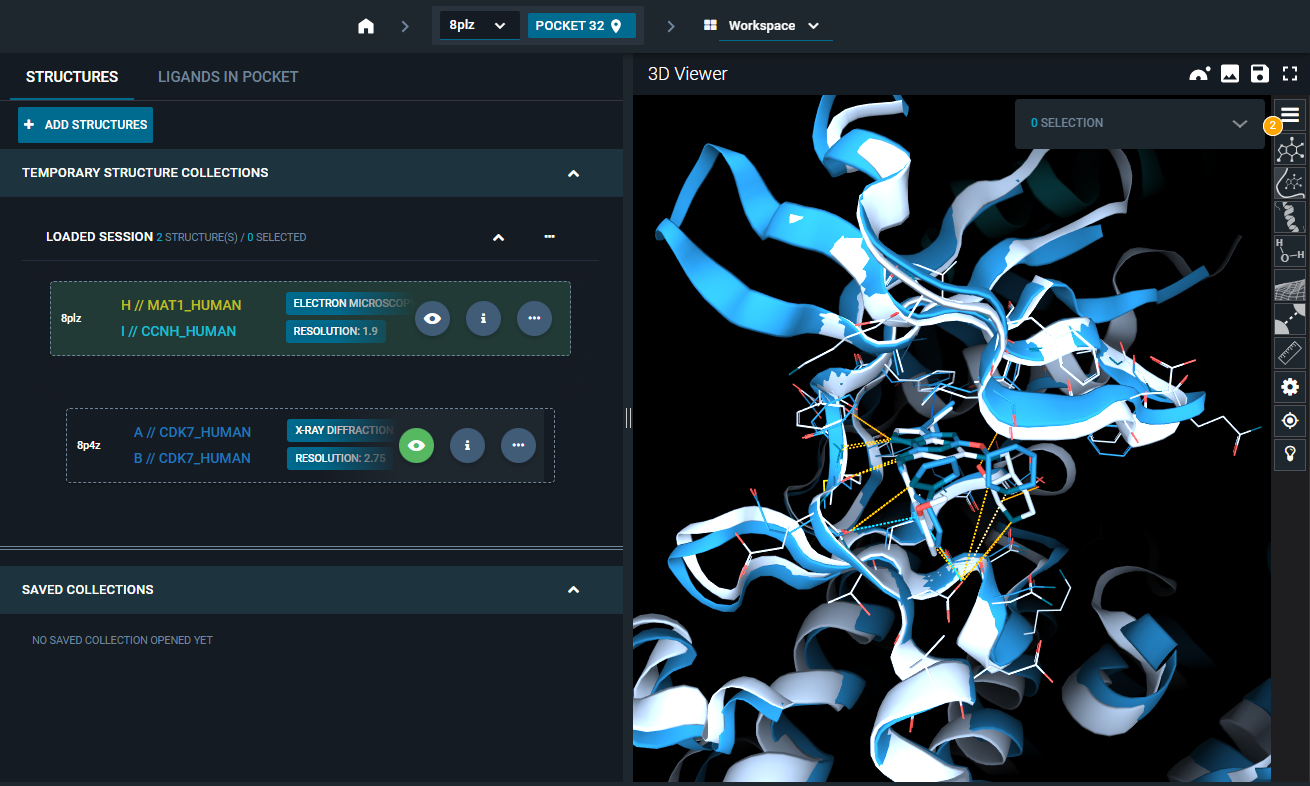
¶ 2. Overlay electron density maps
- Click on the three-dot icon of the "8PLZ" structure, and select the option "Fetch EM map" from the Actions menu. The electron density map of the first structure is loaded in the 3D Viewer and represented as a green mesh.
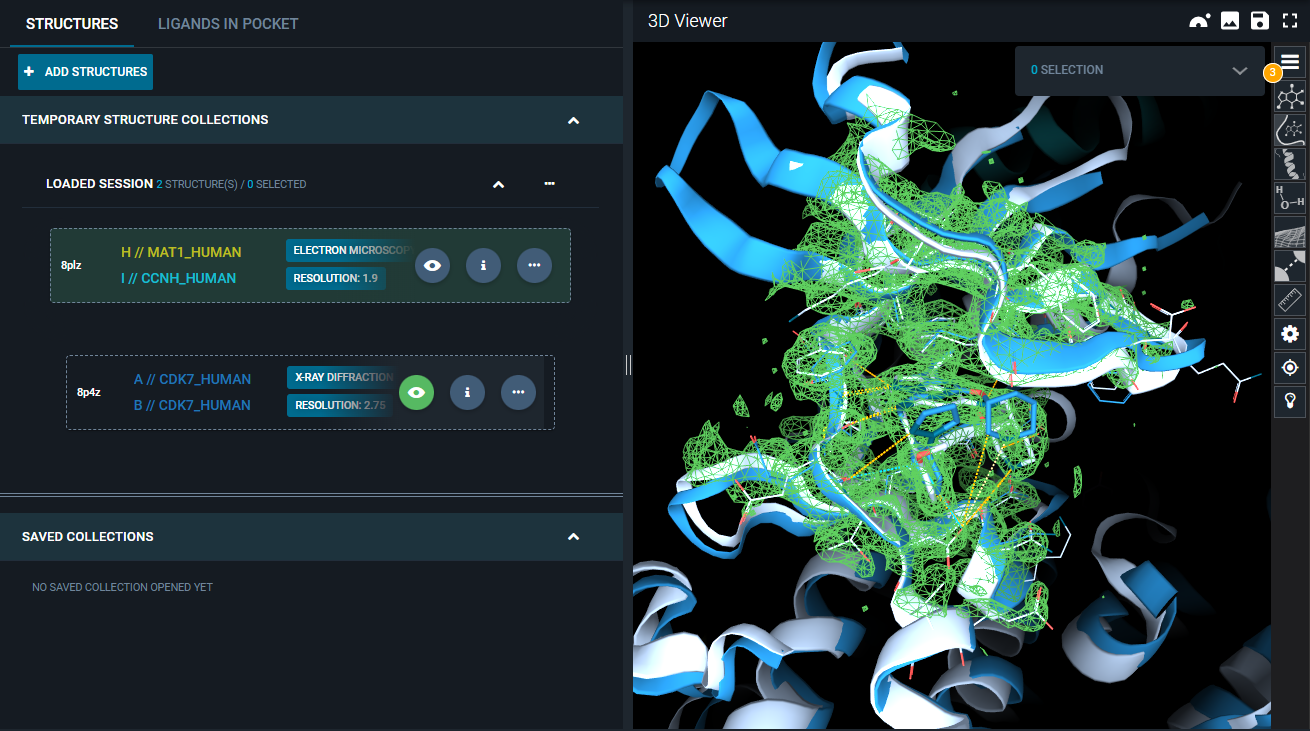
- Click on the three-dot icon of the "8P4Z" structure, and select the option "Fetch electron density" from the Actions menu. From the pop-up, only select the "2mFo-DFc map" (default option), and click "FETCH". The electron density map of the second structure is loaded in the 3D Viewer and represented as a blue mesh.
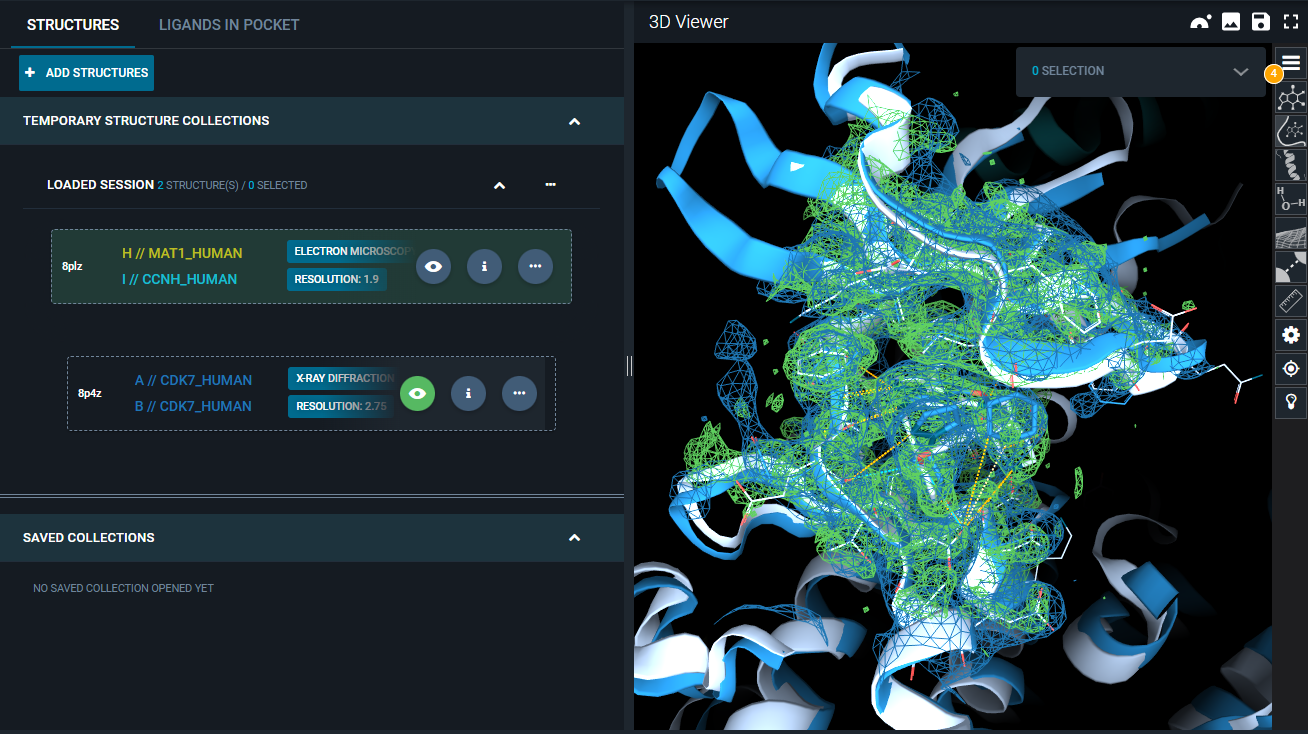
To facilitate the comparison, we will change the representation settings of the first map:
- Click on the "Objects Panel" button, on the top-right of the 3D Viewer.
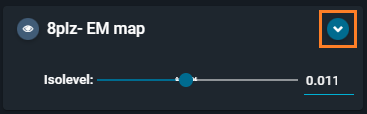
- From the Objects Panel, click on the blue arrow on the electron density map card
8plz- EM mapto unfold the representation options.
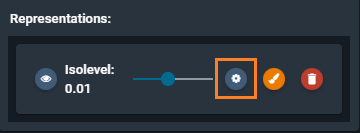
- Click on the "Volume settings" icon (cogwheel button).
- In the "Volume settings" menu, toggle on the Representation option "Solid", and set "Opacity" to 0.7.
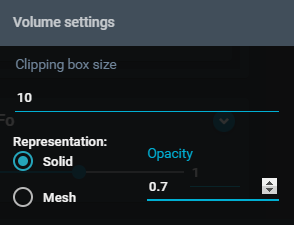
- Click outside the "Volume setting" window to close it. You can see that in the 3D Viewer, the electron density map is now solid.
- Click on the "Color settings" icon (brush button)
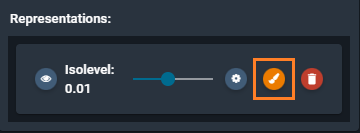
- In the "Color change" menu, select the light orange option.
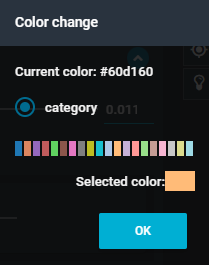
- Click outside the "Volume setting" window to close it. Click outside of the "Objects panel" to close it.
You can now see the superposed electron density maps, with differentiated representation to better visualize the differences.
¶ Proprietary electron density maps
In this tutorial, you will learn how to visualize a proprietary electron density map. The example uses a crystal structure and a .ccp4 map, but you can apply this workflow to any type of experimental structure and (compatible) electron density map.
¶ Pre-requisites
For completing this tutorial, you will need to have a proprietary structure registered in the database.
Here you will only find a simplified version of the structure registration process, for a more in-depth, step-by-step guide we have a dedicated tutorial for structure registration on this page.
Electron Density Maps compatibility: remember that 3decision supports the map file formats listed here, and
.mtzfiles.
¶ 1. Register a proprietary structure (optional)
If you already have your proprietary structure registered in the database and only want to attach the corresponding proprietary electron density map, you can skip this section.
Here you find the Structure File of the structure to register in this tutorial: 3le6
- From the 3decision homepage, click on the "Register New Structure" button (arrow button from the left-side menu).
- In the new window, select the option "New Structure".
- Upload the provided structure file. You get two green success messages (File successfully uploaded, and File successfully parsed.
- Click on the "NEXT" blue button.
- In the "Identify Chains" section you should see one chain, with Biomolecule code
P24941. Scroll down and click on "NEXT" at the bottom of the page. - In the "Identify Ligands" you should see the ligand
2BZScroll down and click on "NEXT" at the bottom of the page. - In the "Edit Metadata" section, you should have pre-filled the fields "Title", "Resolution" and "Method". Rename the structure title:
3decision Tutorial: proprietary electron density maps. - Click on "NEXT" at the bottom of the page.
- From the "Summary" page, click on "SUBMIT STRUCTURE" button.
- After 1-2 minutes, you get a green, success message and an external code of 6-digits. Note down this external code, you will need it for the next section.
- (Optional step) Click on "OPEN STRUCTURE" green button to quickly check that the structure has been correctly registered in the database: in the 3D Viewer, you should see the 3D structure of your protein and focusing on the ligand binding site you see protein-ligand interactions; on the top of the page you see a reference pocket (e.g., "POCKET 20"; from the structure card on the left you see the protein chains with Biomolecular code "CDK2_HUMAN". If you do not see one (or more) of the above, try to refresh the page: post-registration analyses takes several minutes and could still be running.
¶ 2. Attach the corresponding electron density map(s)
In this section we will describe how to add the corresponding electron density map to the proprietary structure from the UI. You can also do it from the API (reference to this page of the user documentation).
Here you find the map file to attach to the example structure used in this tutorial: 3le6.ccp4
For the next steps, you need the external code of the proprietary structure you want to associate the map file to. In this tutorial, the external code is the output of the previous step. If you missed to copy the external code, you can retrieve it from the "My Structures" panel: from the 3decision homepage, click on the "My profile" button from the left-side menu, and select the option "My Structures".
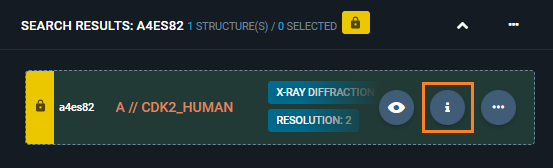
- From the 3decision homepage, run a basic search using the external code of your proprietary structure.
- From the results page, select the structure and click on the "OPEN" blue button at the top-right of the page, to open it in the workspace.
- From the structure card on the left, click the "i" button.
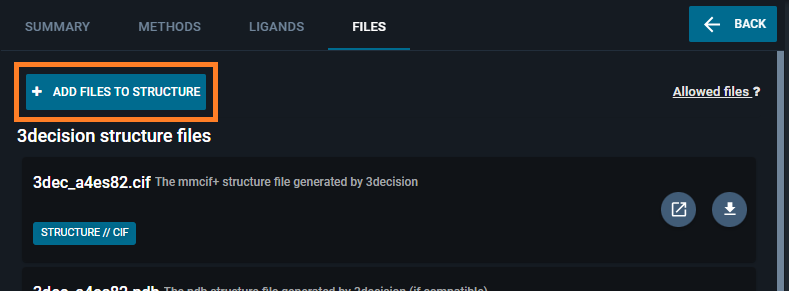
- The Information Browser is opened on the left-side of the screen. Click on the "FILES" tab.
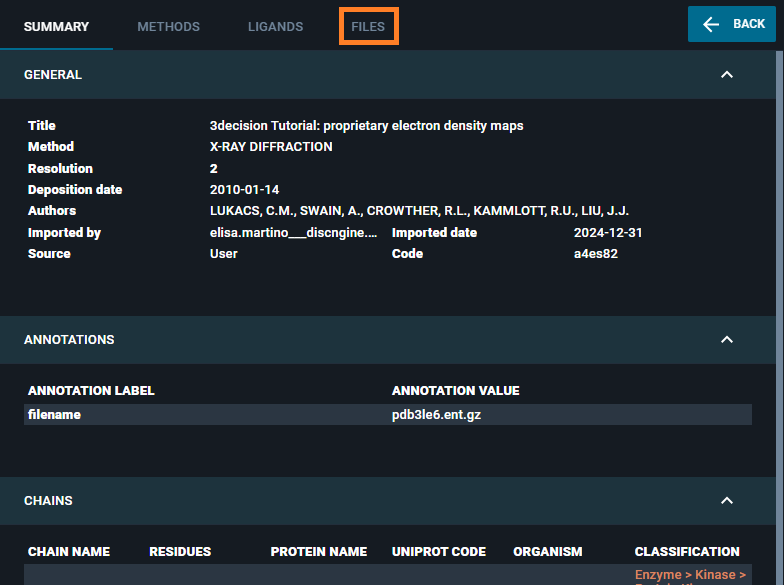
- Click on the "ADD FILES TO STRUCTURE" button.
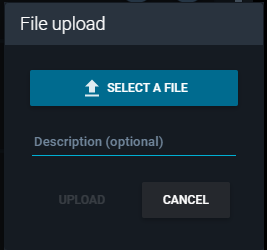
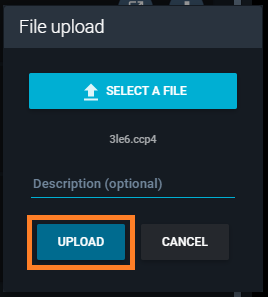
- From the "File upload" window that appears, click the button "SELECT A FILE" and select the map file (provided at the beginning of this section).
- Click the "UPLOAD" button.
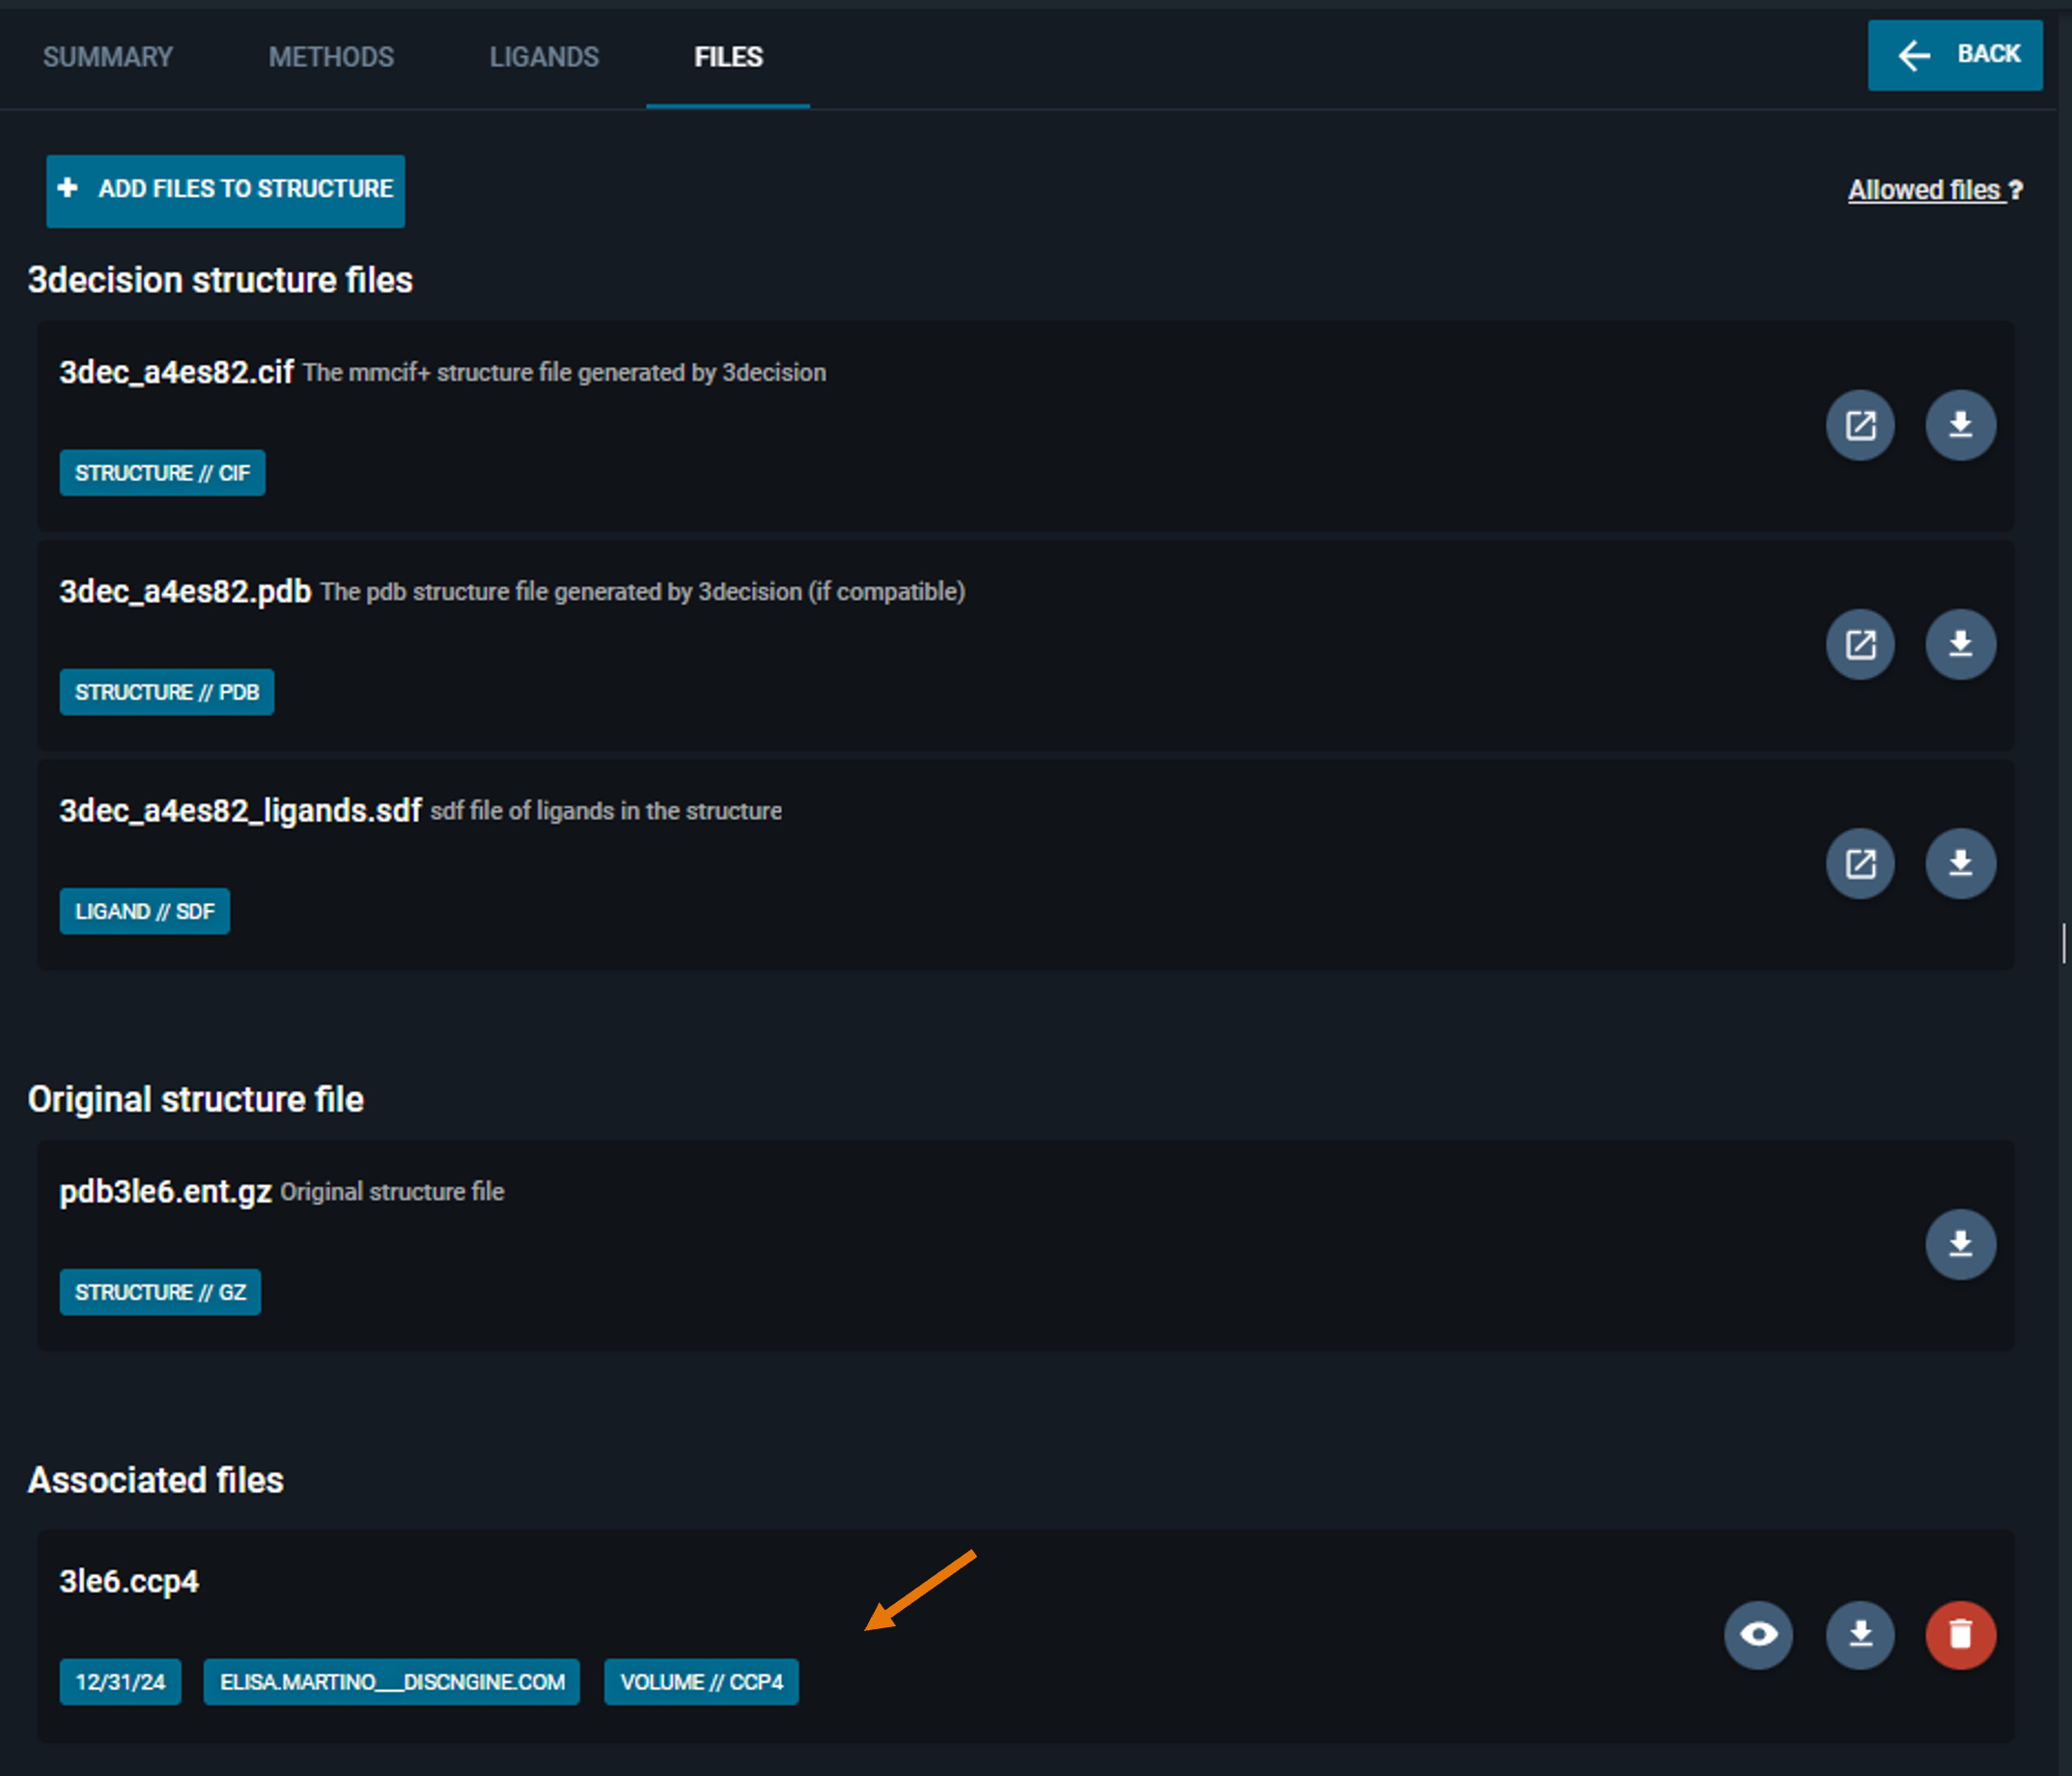
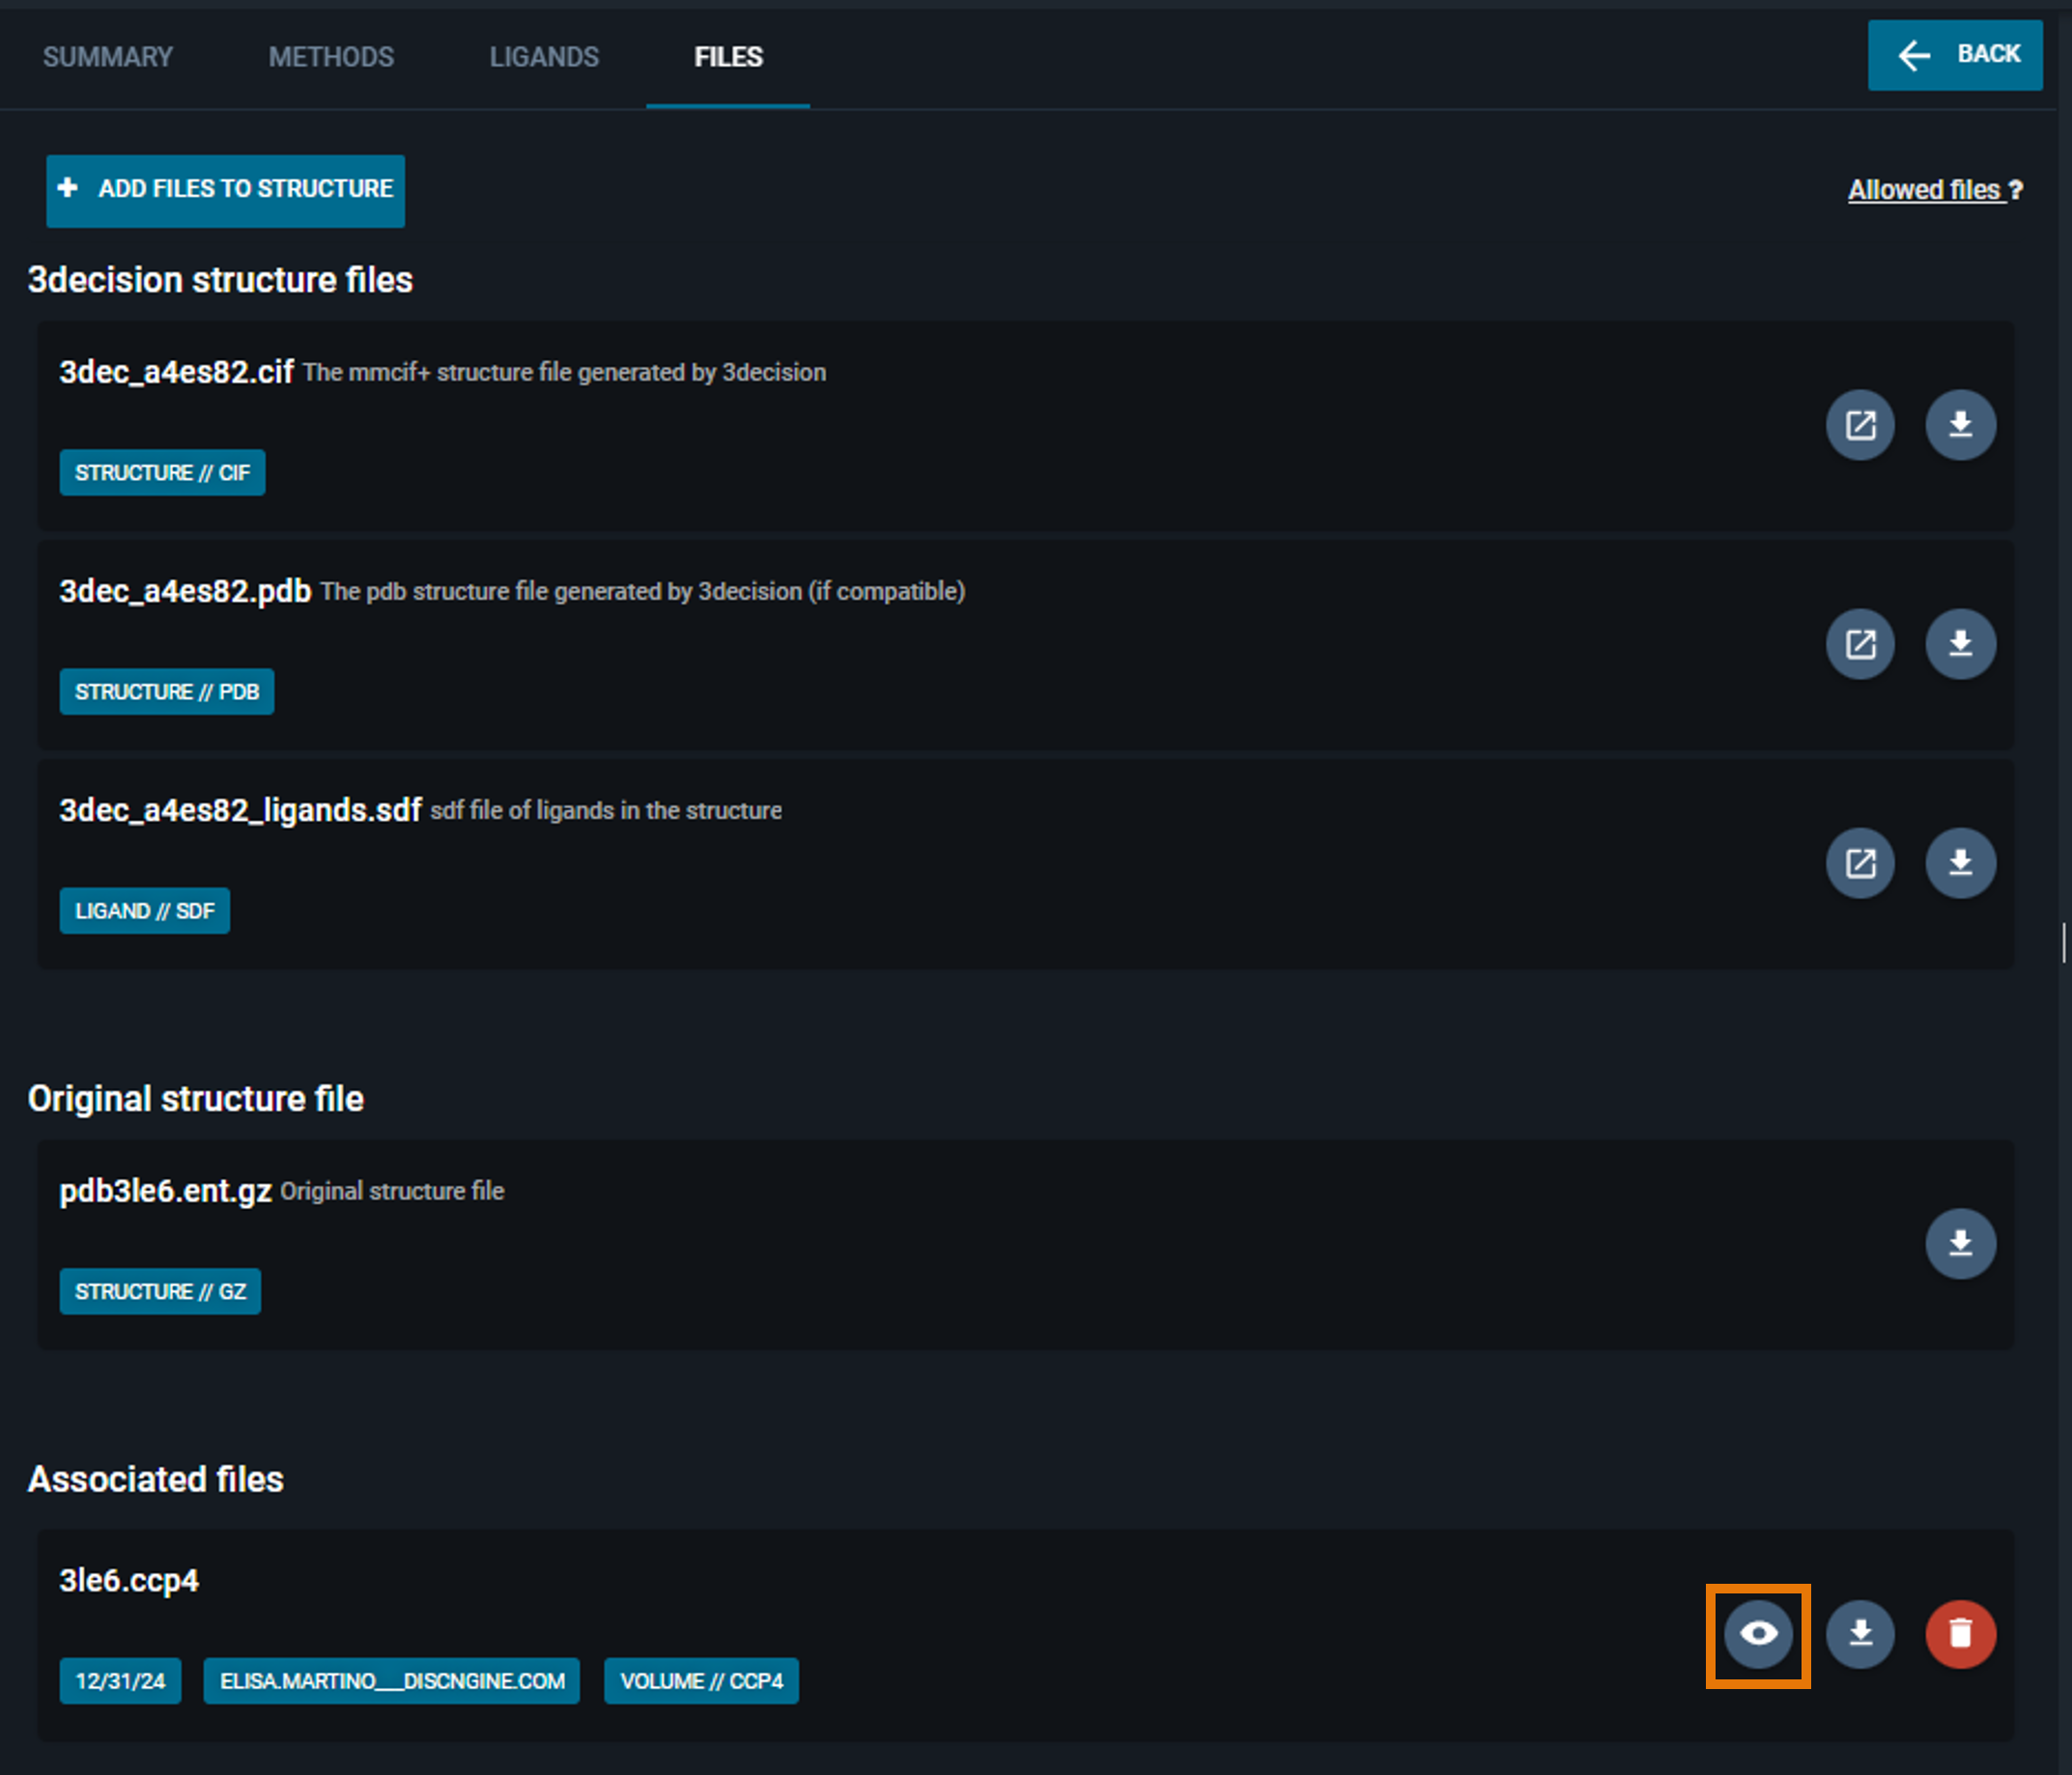
You find the new file in the "Associated files" section of this page.
¶ 3. Visualize proprietary electron density maps
You have two options to visualize the electron density map in the 3D Viewer:
- from the Information Browser (Files tab)
- from the Structure Actions in the Workspace
Here we describe the process from the Information Browser, continuing from the previous section of the tutorial. The other option is described in this section of the documentation.
- Click on the "eye icon" button on map you just uploaded (In the Information Browser, under the "FILES" tab).
The map is now loaded in the 3D Viewer:
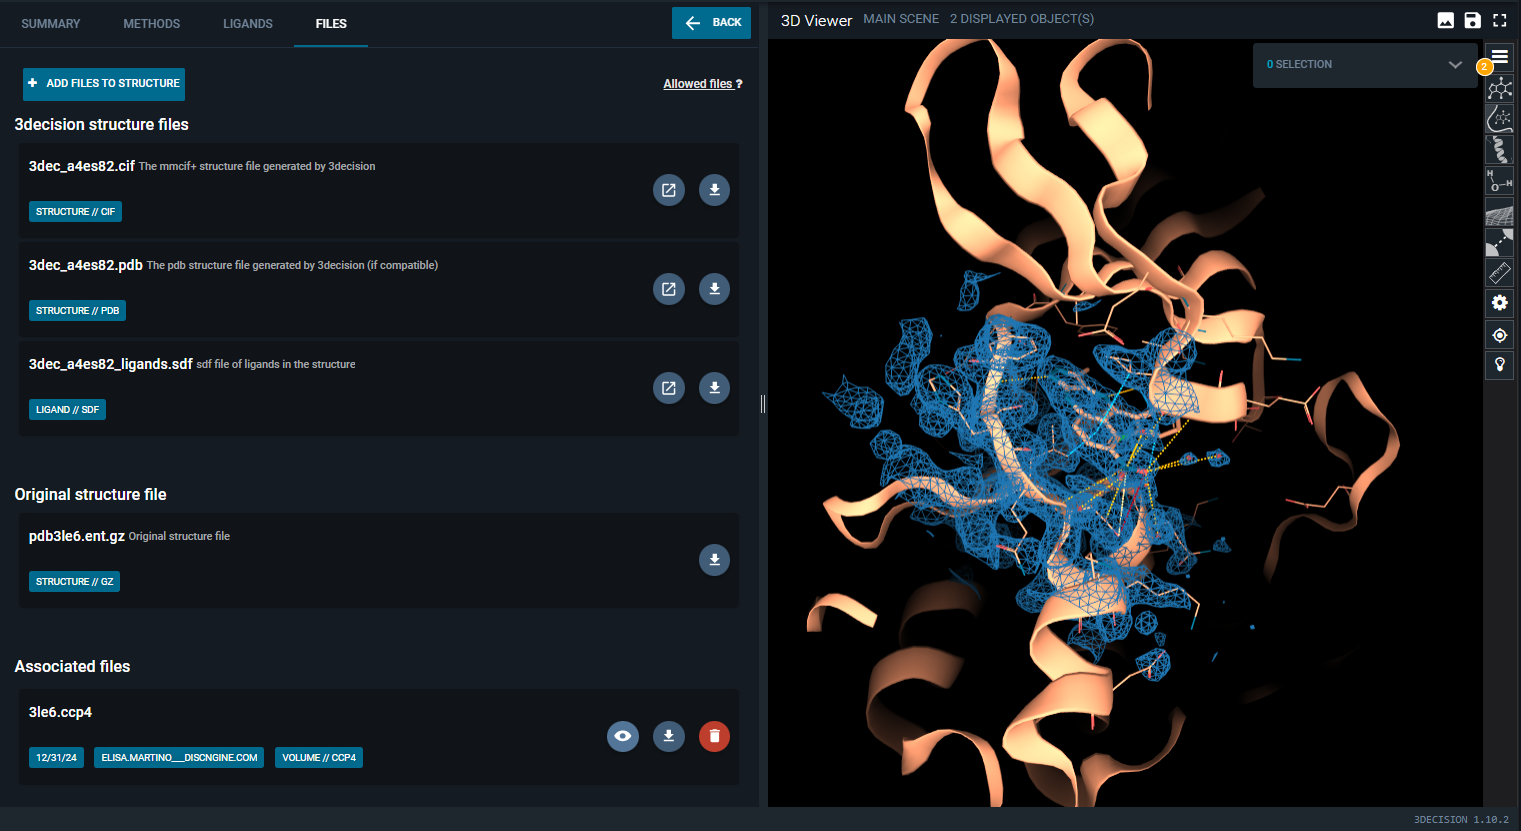
You can then edit representation settings as for public data, as described in the section above.