¶ Introduction
The Annotation Browser allows to map structure and sequence annotations onto a 3D structure. This feature also allows you to add and visualize your own annotations.
This layout combines, on the left side, sequence annotations which have interactive selection with the 3D Viewer, on the right side. Each protein chain in the structure is displayed on the left under its Uniprot identifier. The full sequence and a list of annotations, coming from various sources are displayed.
¶ Access
You can access the Annotation Browser by clicking on Workspace at the top of the Workspace page. In the drop-down menu, it will appear at the top.

Click on Annotation Browser, it will bring you to a new page on the left part. The right part remains the 3D Viewer.
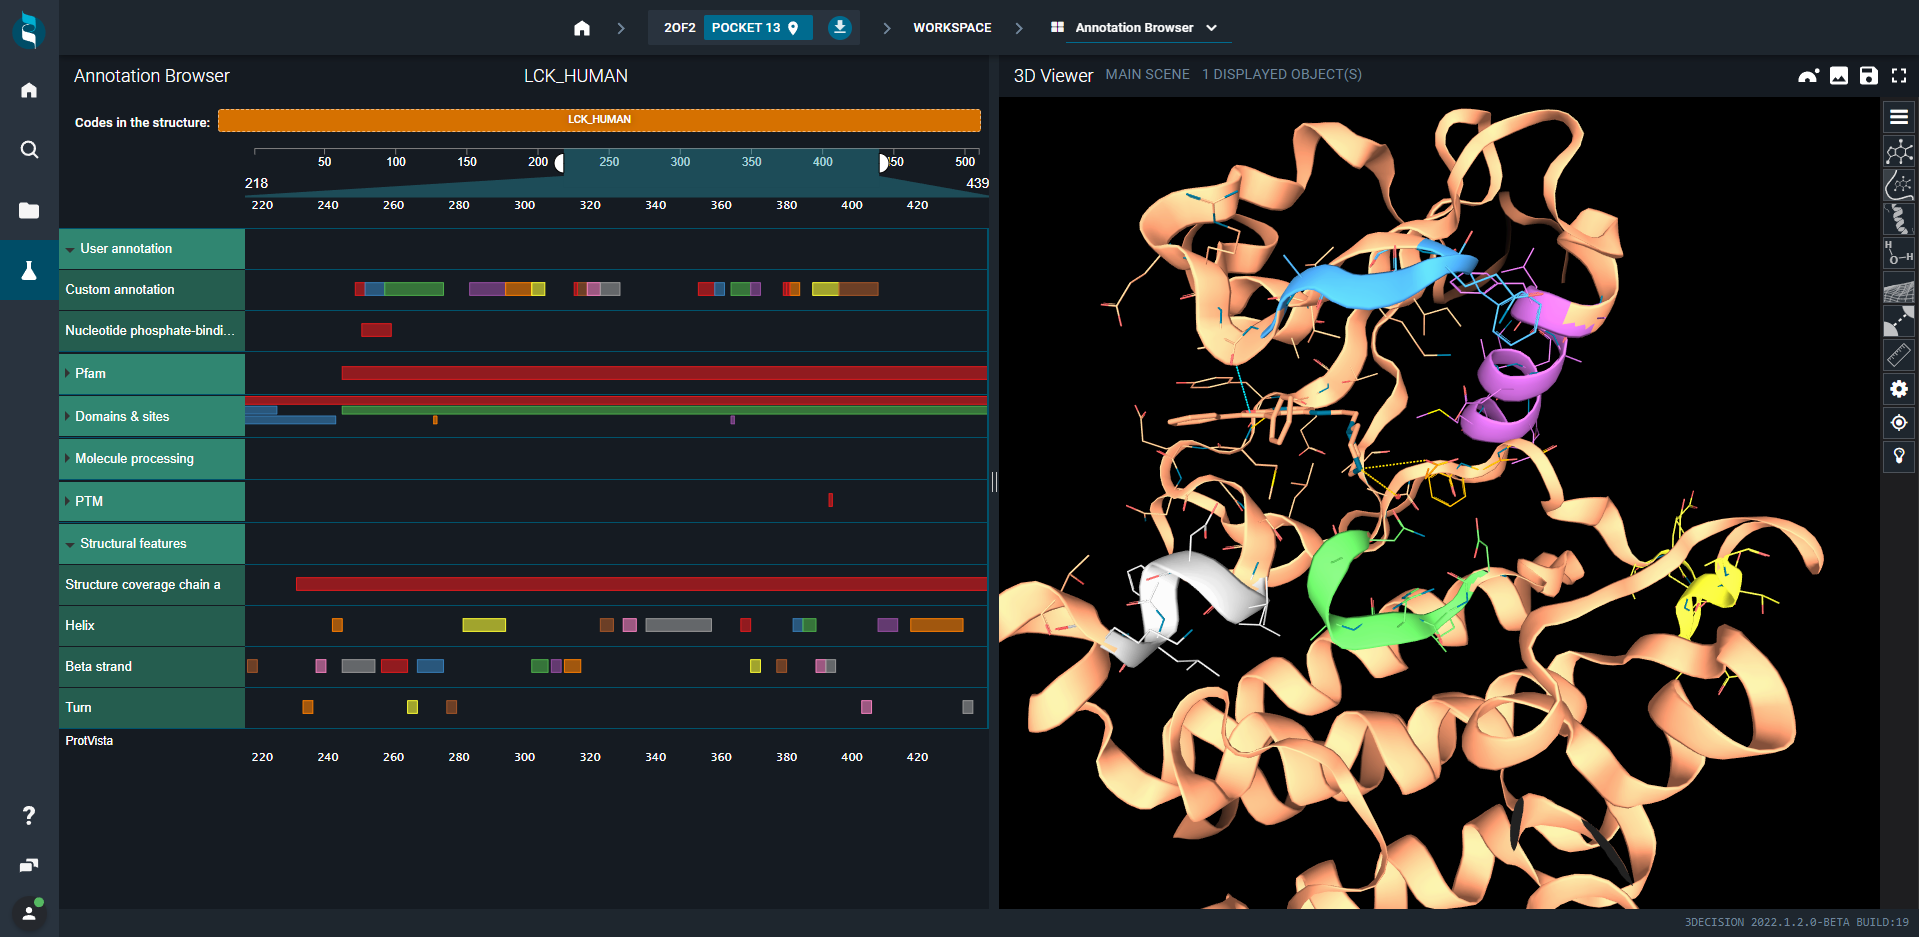
When you click on one square/annotation, the corresponding region of the 3D structure is colored accordingly and the view in the 3D Viewer is automatically focused on it.
¶ List of displayed annotations
- User annotation
- custom annotation (3decision will display specific annotations for Kinase, GPCR, antibody...)
- nucleotide phosphate binding region
- Pfam
- Pfam annotation
- Domains & site
- Prosite
- Chain
- Topological domain
- Transmembrane region
- Region and interest
- Binding site
- Mutagenesis site
- PTM
- Modified residue
- Glycosylation site
- Cross-link
- Structural features
- Structure coverage for each chain
- Helix
- Turn
- Beta strand
Some annotations are specific to the protein class. To focus on the different kinase specific domain, you can investigate “Custom Annotations” (examples: alpha-C helix, DFG pattern, activation loop...). This window allows the quick visualization of the residues that compose each domain.
¶ Specific use-cases
We will here compare in 3decision workspace three kinase structures, respectively with inhibitor type I PFB: 1M17, type ½ PDB: 1XKK and type II PDB:1IEP. Using the highlight mode, we can focus only on the differences present on the binding site of these structures. It is also possible to expand this behaviour to the full structure.
To better orient ourselves on the analysis of the binding site of these structures we will use the annotation browser of 3decision. This layout combines on left-hand side sequence annotations which have interactive selection with the 3D viewer on the right-hand side.
Each protein chain in the structure is displayed on the left under its Uniprot identifier.
Under the protein identifier, we have the full sequence and a list of annotations, coming from various sources.
¶ Kinases
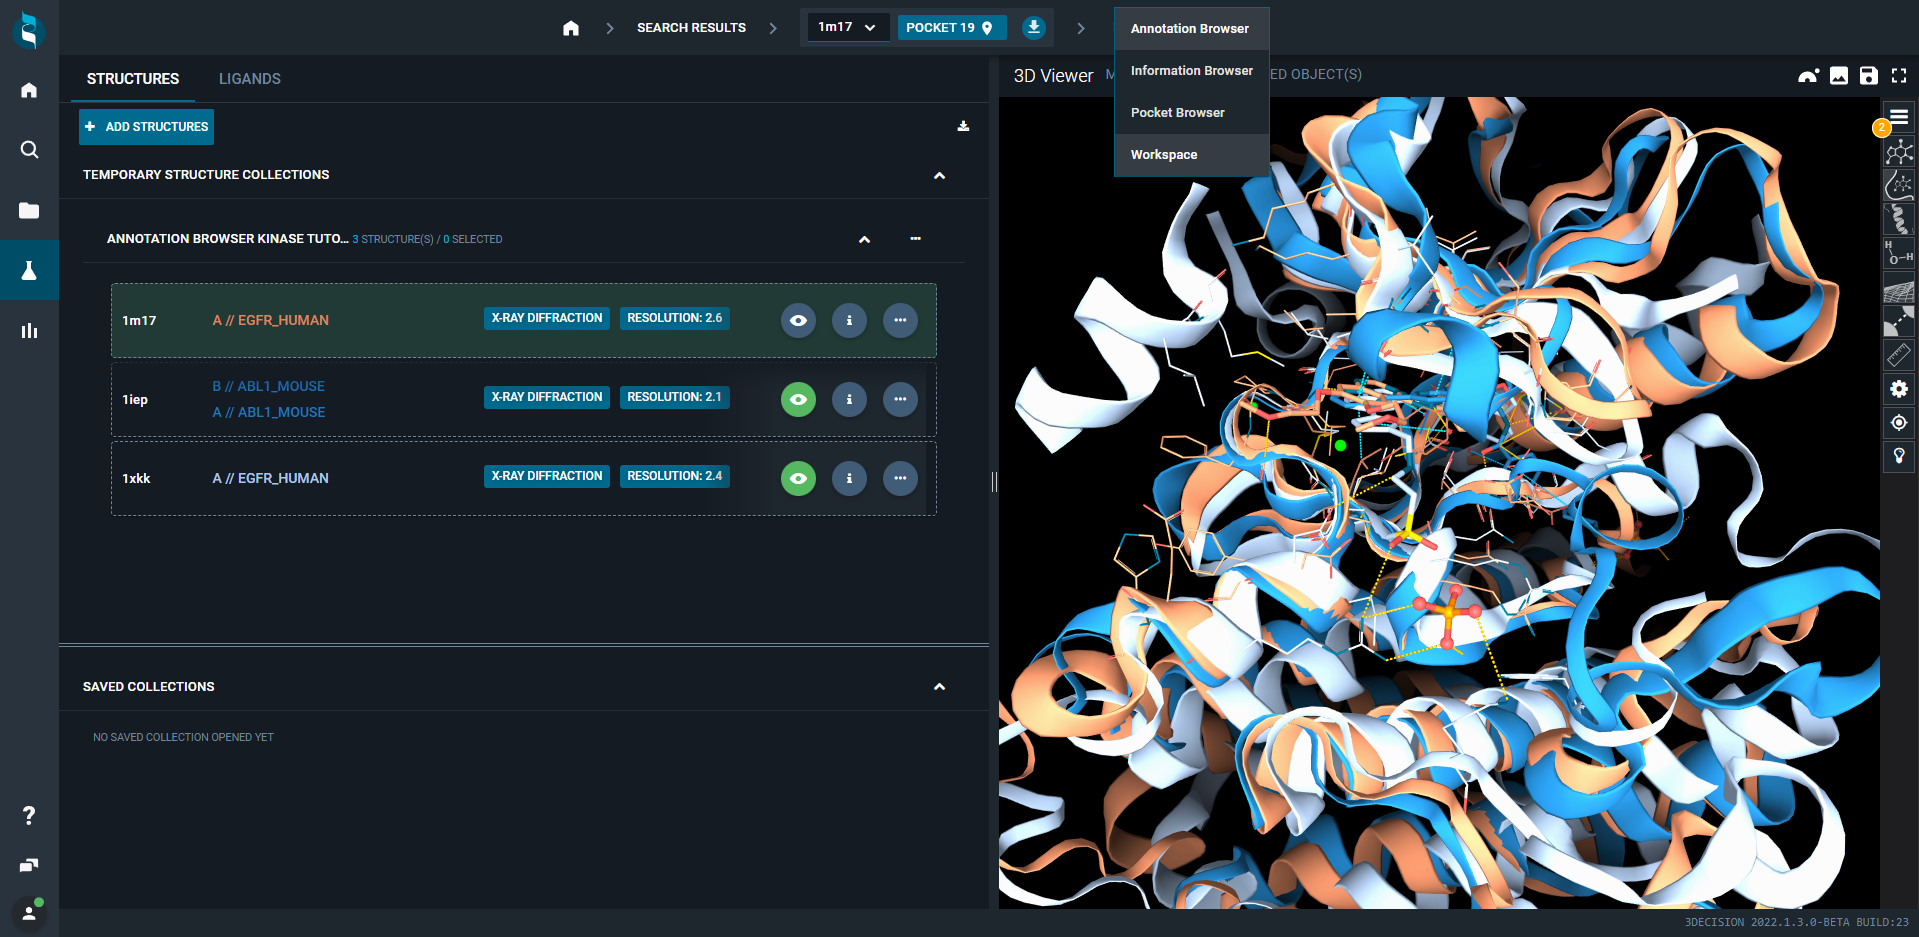
- Load the structures 1M17, 1XKK and 1IEP in the workspace
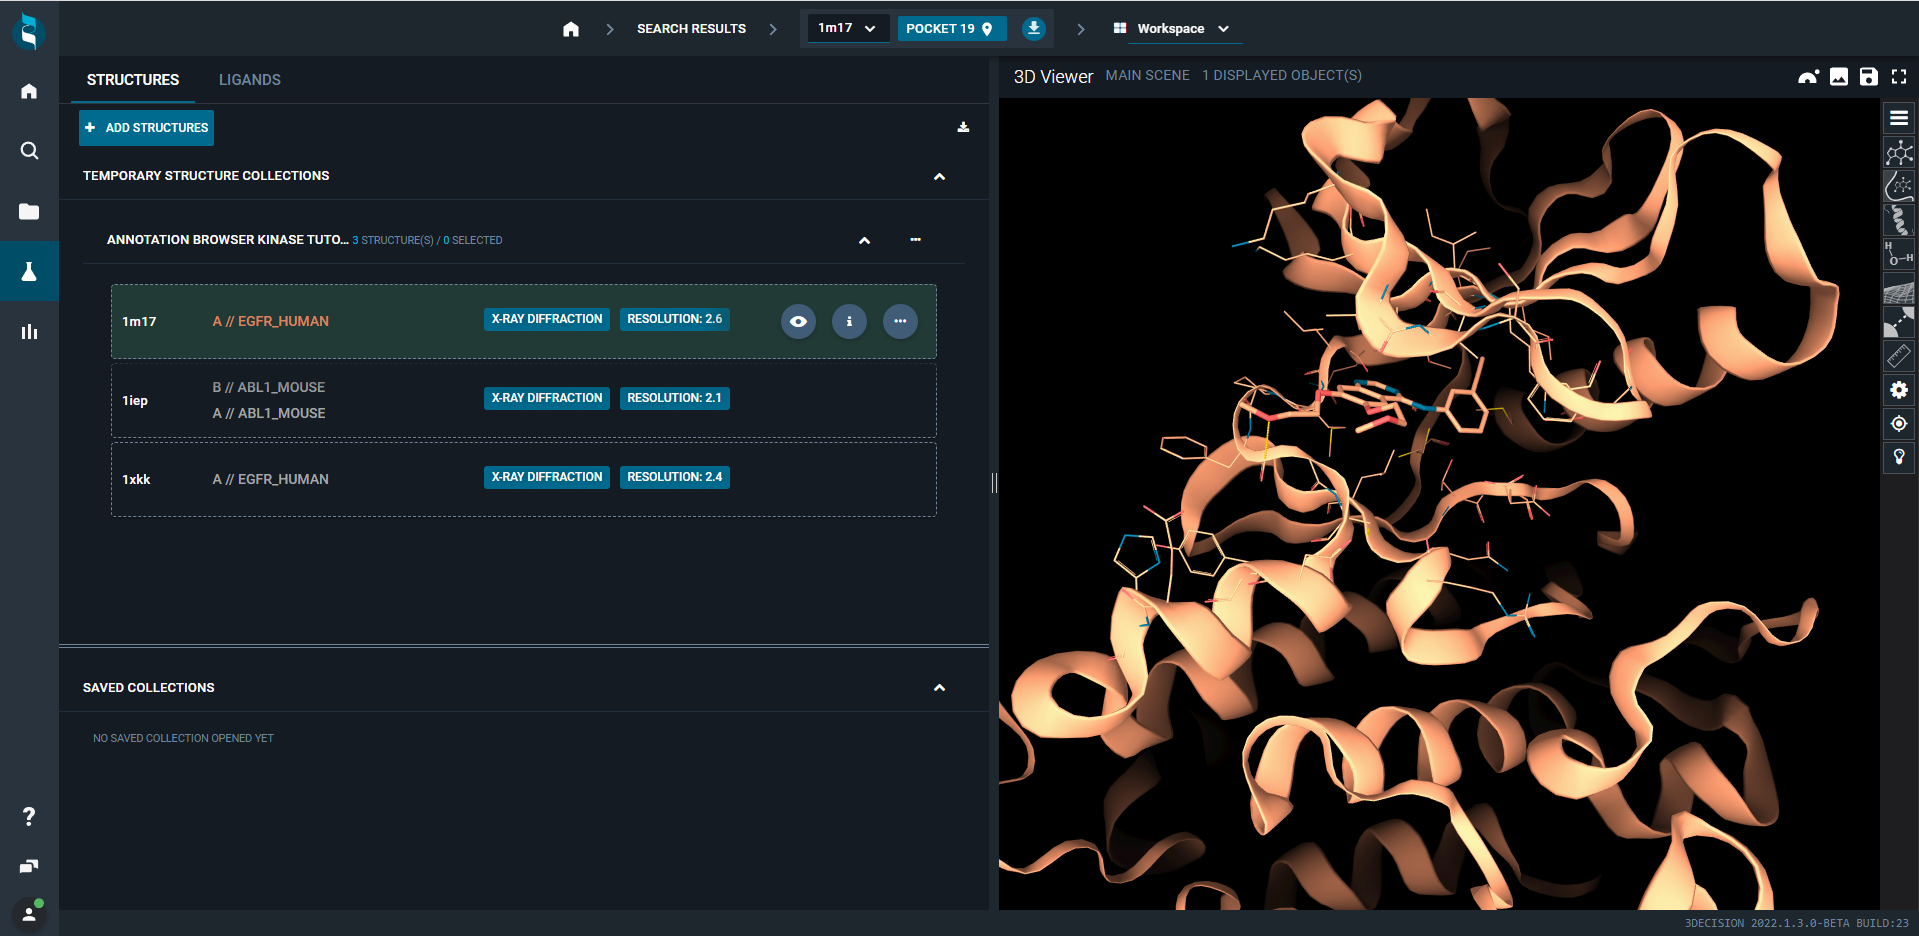
- Align the three structures by clicking on the eye button next to each structure
- Go from Workspace to Annotation Browser at the top of the page using the drop-down menu
¶ Compare alpha-C helices
- Keep only 1M17 and 1XKK structures in the 3D viewer
- Click on the user annotation line to expand it
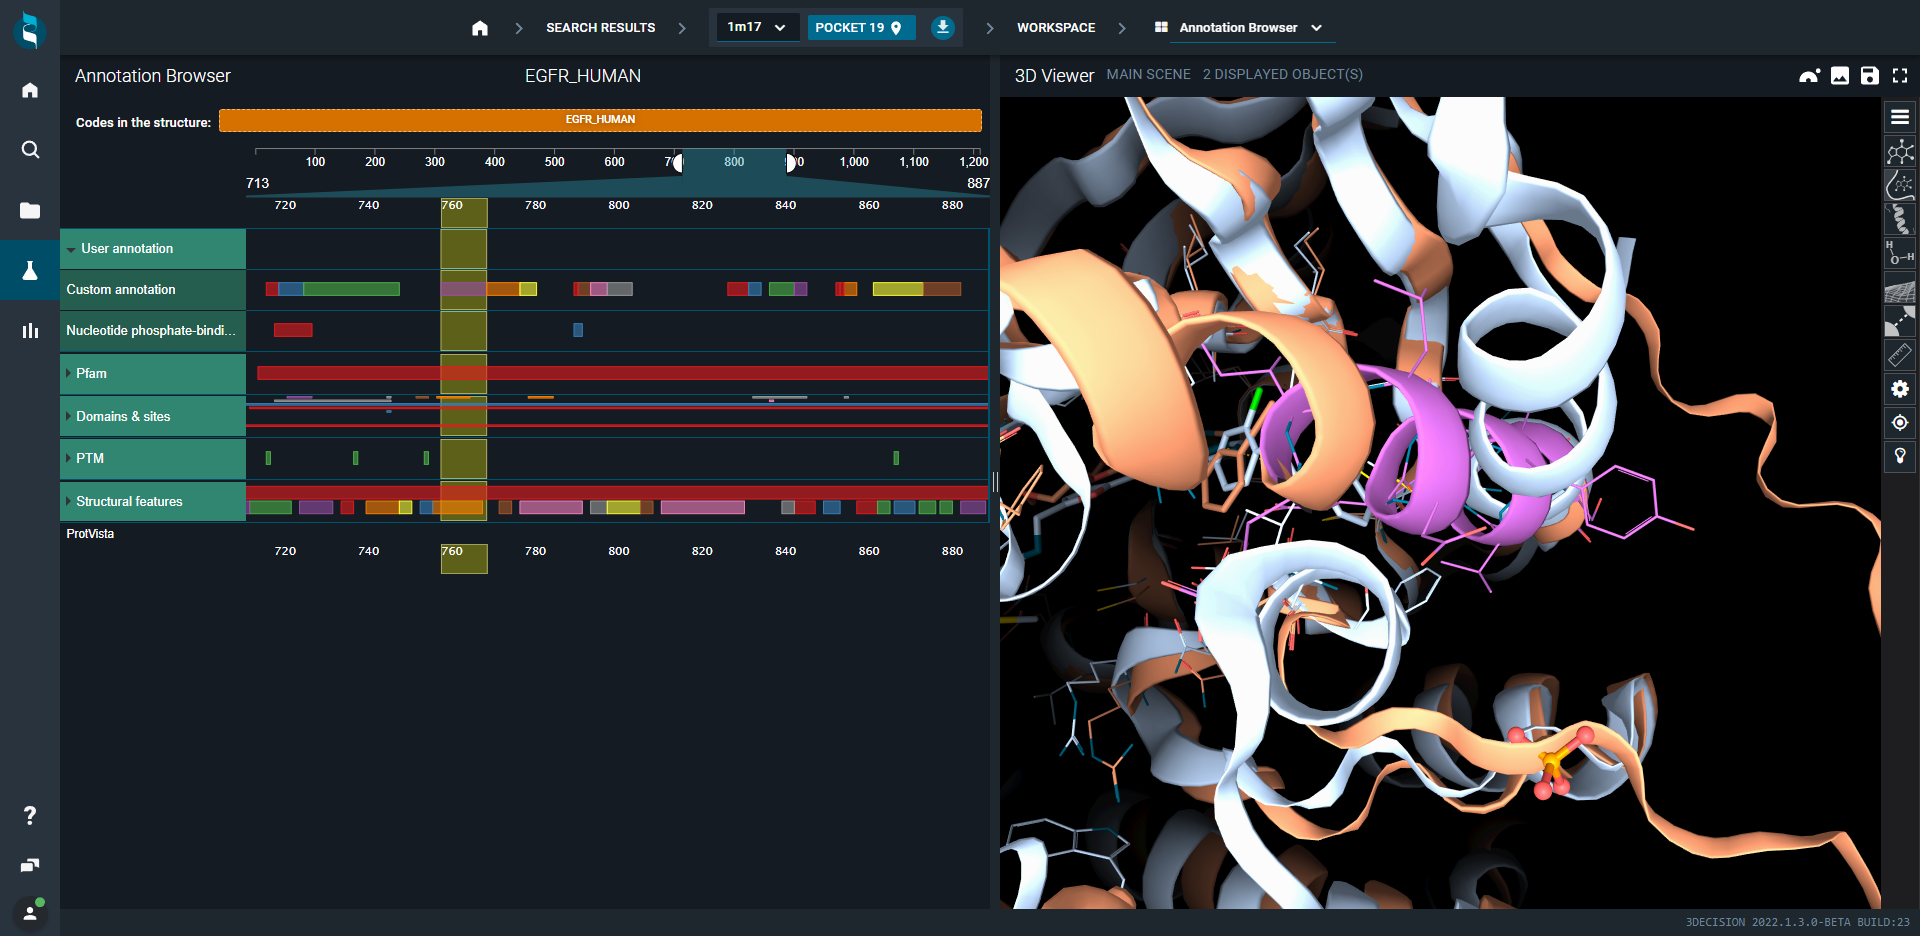
- Zoom in the custom annotation line and click on the domain called alpha-C helix
The focus is done automatically on the annotation you selected.
IMAGE
- Toggle on Highlight mode Full Structure
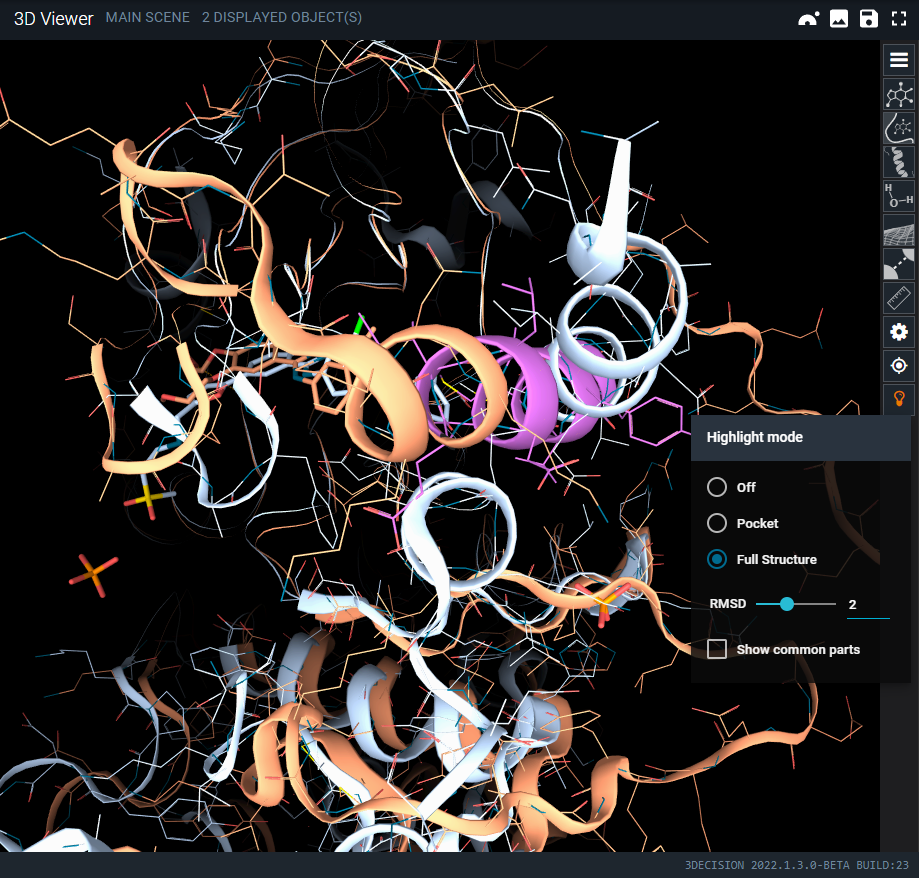
As you have seen, in a couple of clicks, the annotation browser allows you to quickly identify the key differences of kinase in complex with different types of kinase inhibitor.
¶ Compare activation loops
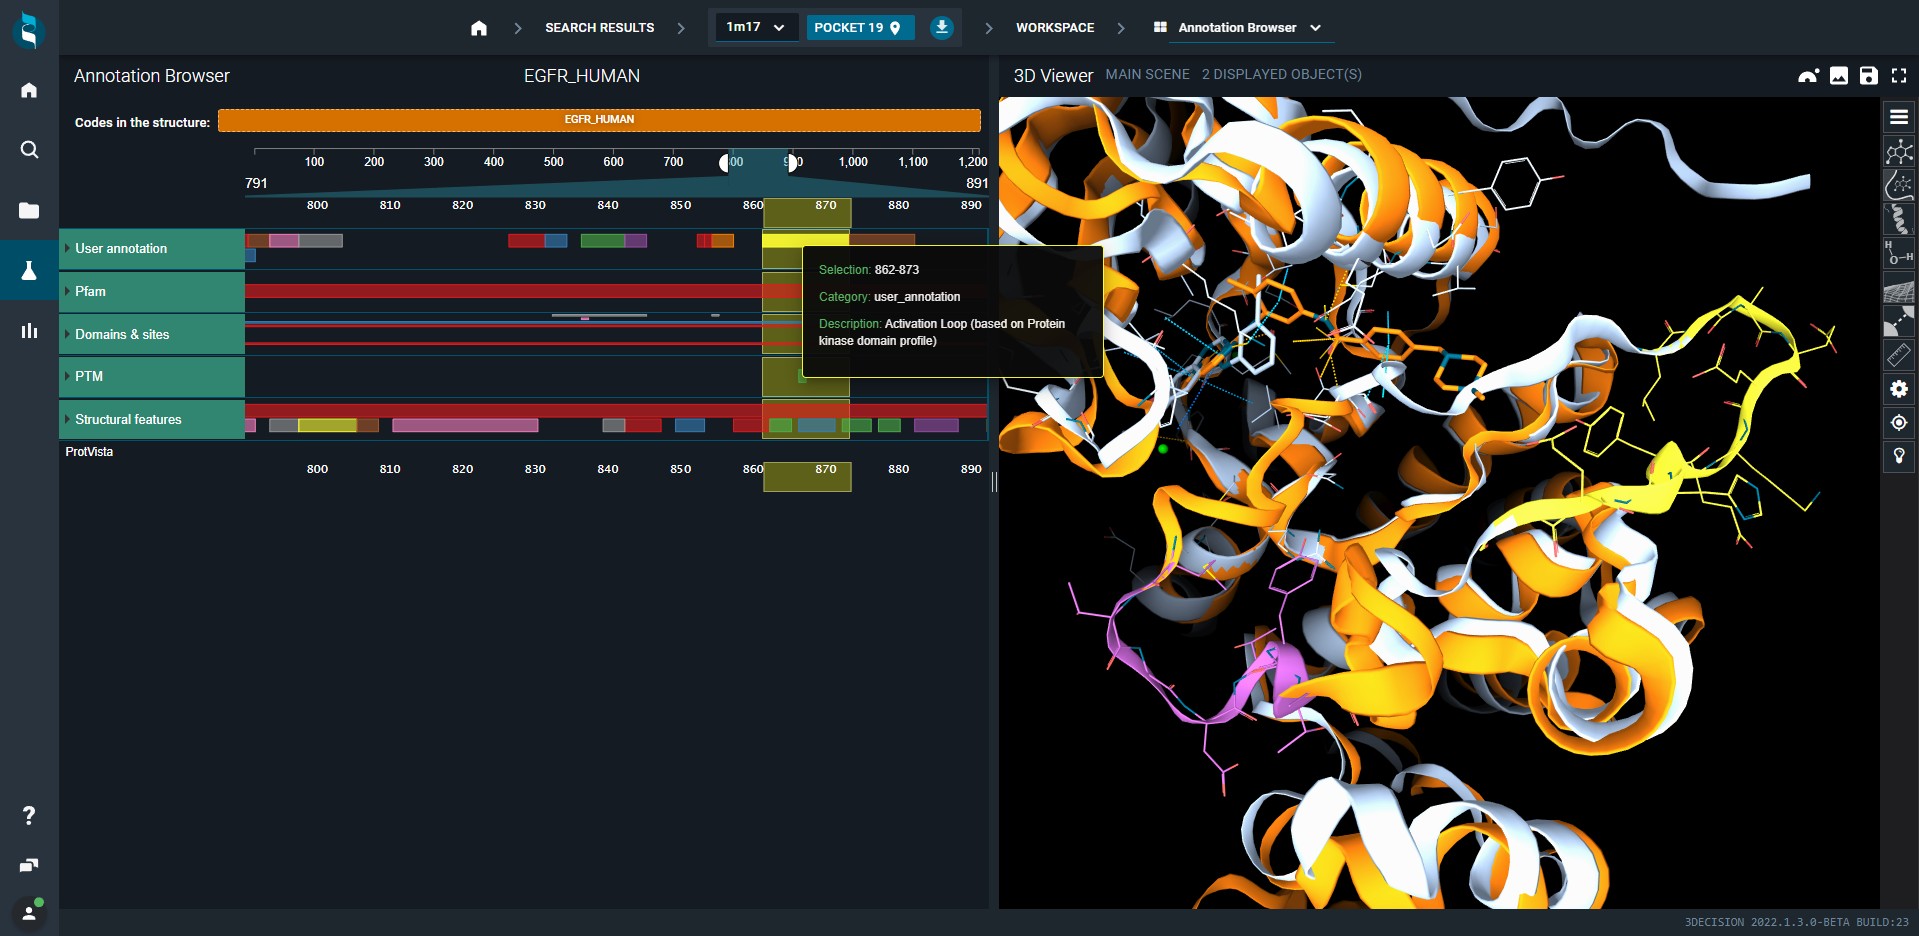
- Keep only 1M17 and 1IEP structures in the 3D viewer
- Click on the square to zoom on activation loop. See how the loop is shifting right (1M17, yellow section in white structure) and left (1IEP, purple section in orange structure) depending on the ligand bound to the site
¶ GPCR
The numbering scheme by Ballesteros and Weinstein is based on the presence of highly conserved residues in each of the seven transmembrane (TM) helices and can be therefore used to compare any amino acid residue in the structurally conserved TM helices of GPCRs.
In this use-case, the goal is to localize a residue on a 3D structure using a protein-specific numbering scheme (e.g. Ballesteros–Weinstein for GPCRs)
- Type 6KPC in the text search and click on the loop (Run search) or Enter
- Open the structure in the workspace
- Switch to Annotation Browser (on the top). On the left-hand side is the annotation map which has an interactive selection with the 3D viewer. The map has the protein or antibody Uniprot identifiers on the top. By default the selected entry on the left is shown in the 3D viewer.
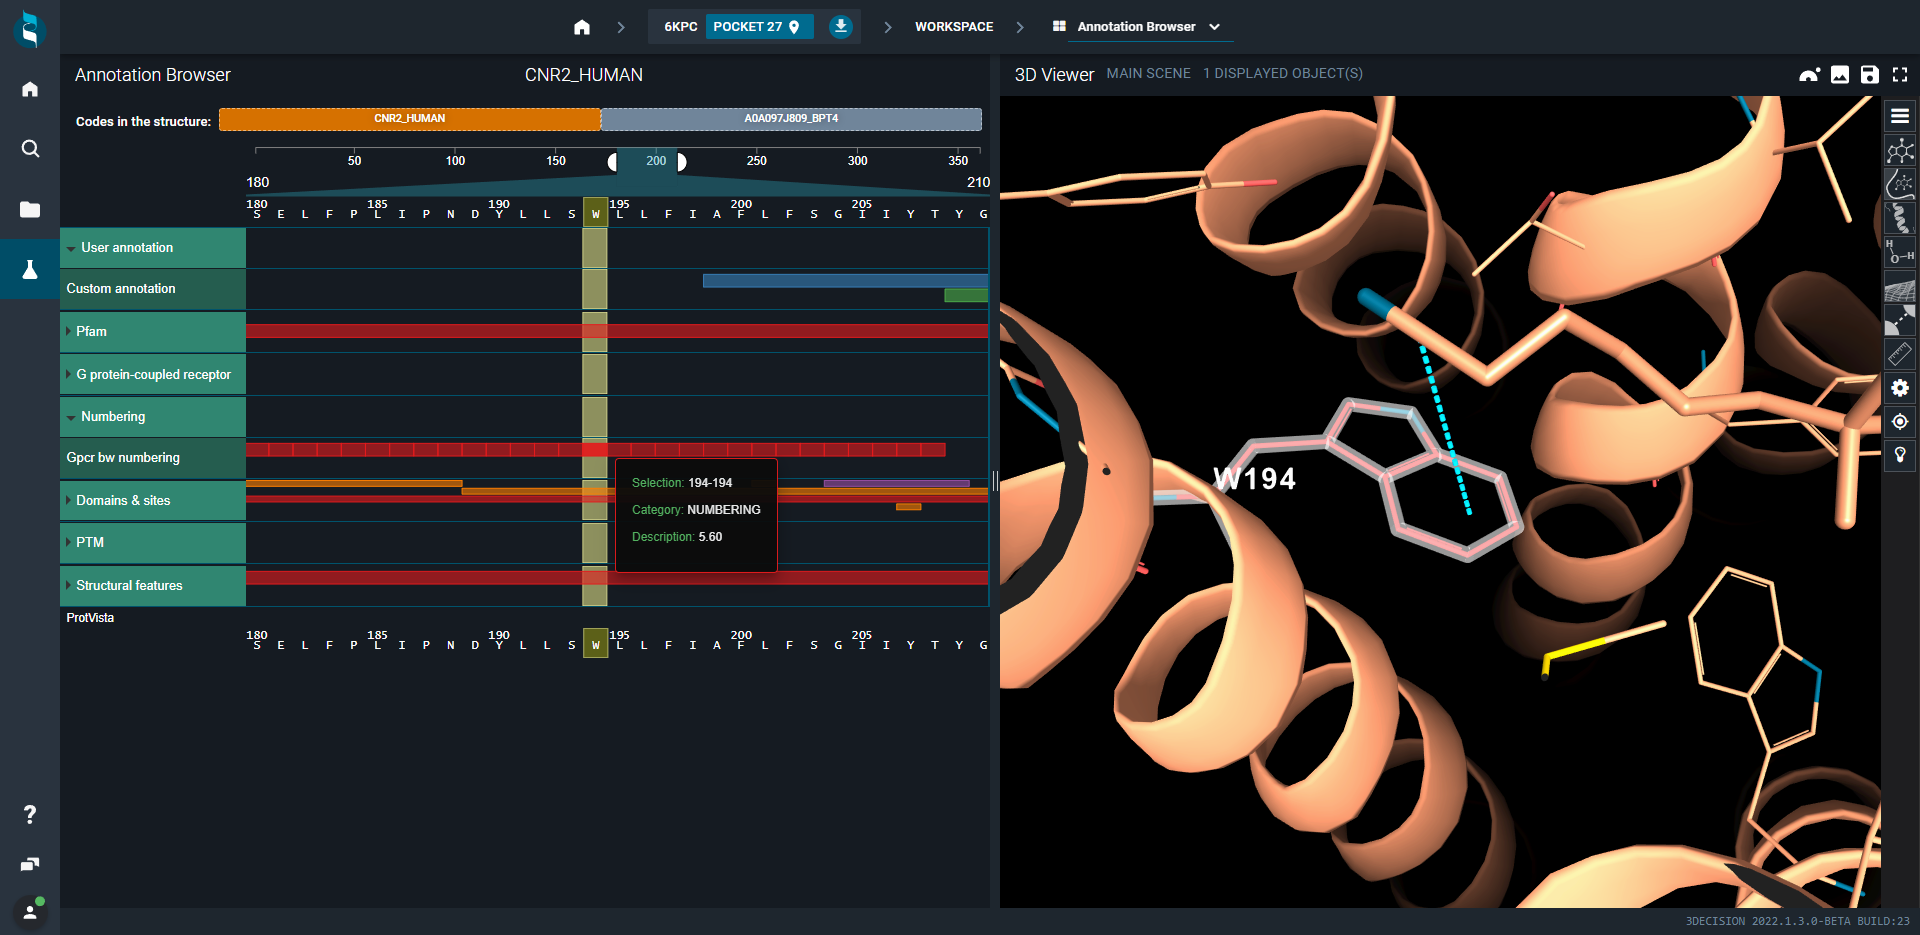
- Click on Numbering and then over with the mouse on one of the square highlights to show the information about the GPCR Ballesteros–Weinstein numbering.
- Click on the residue 5.60 and look how the residue is now highlighted in the 3D viewer. Look to the specific interaction it has with nitrile moiety of the ligand.
¶ Blogpost
Please find another nice use-case of S1PR1 GPCR protein on our 3decision blog.
¶ Antibody CDR
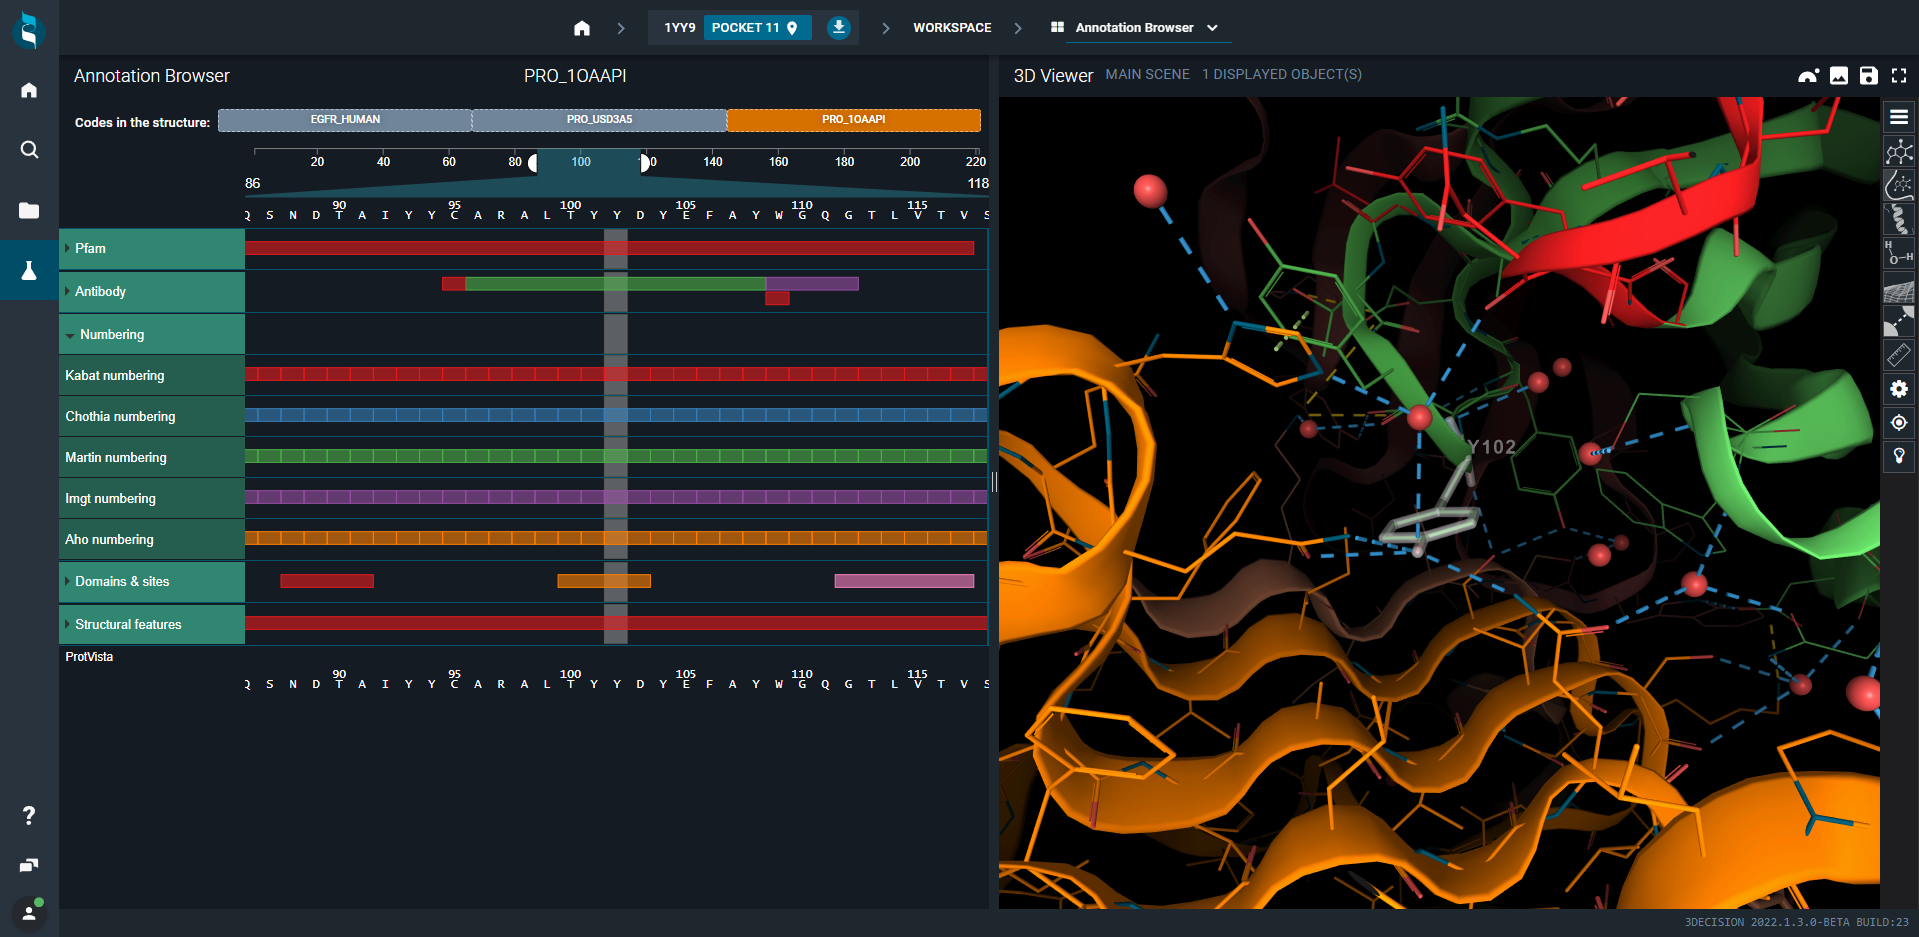
- Open 1YY9 (EGFR/cetuximab structure)
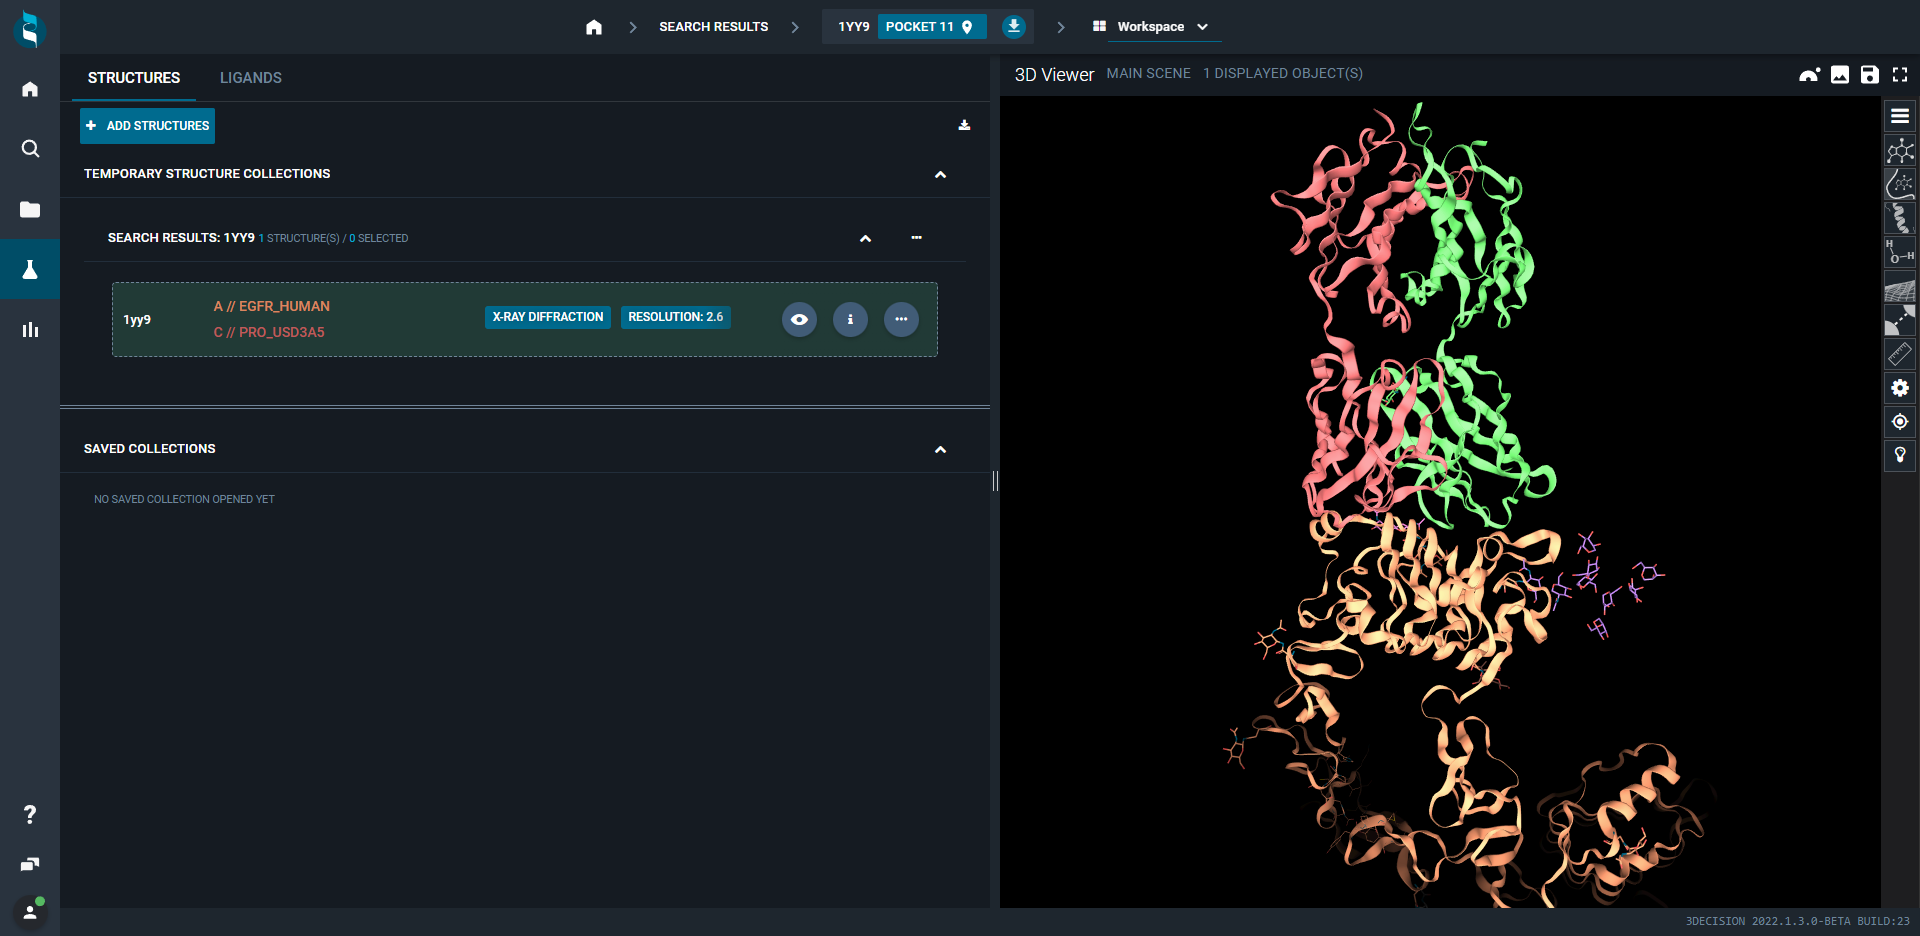
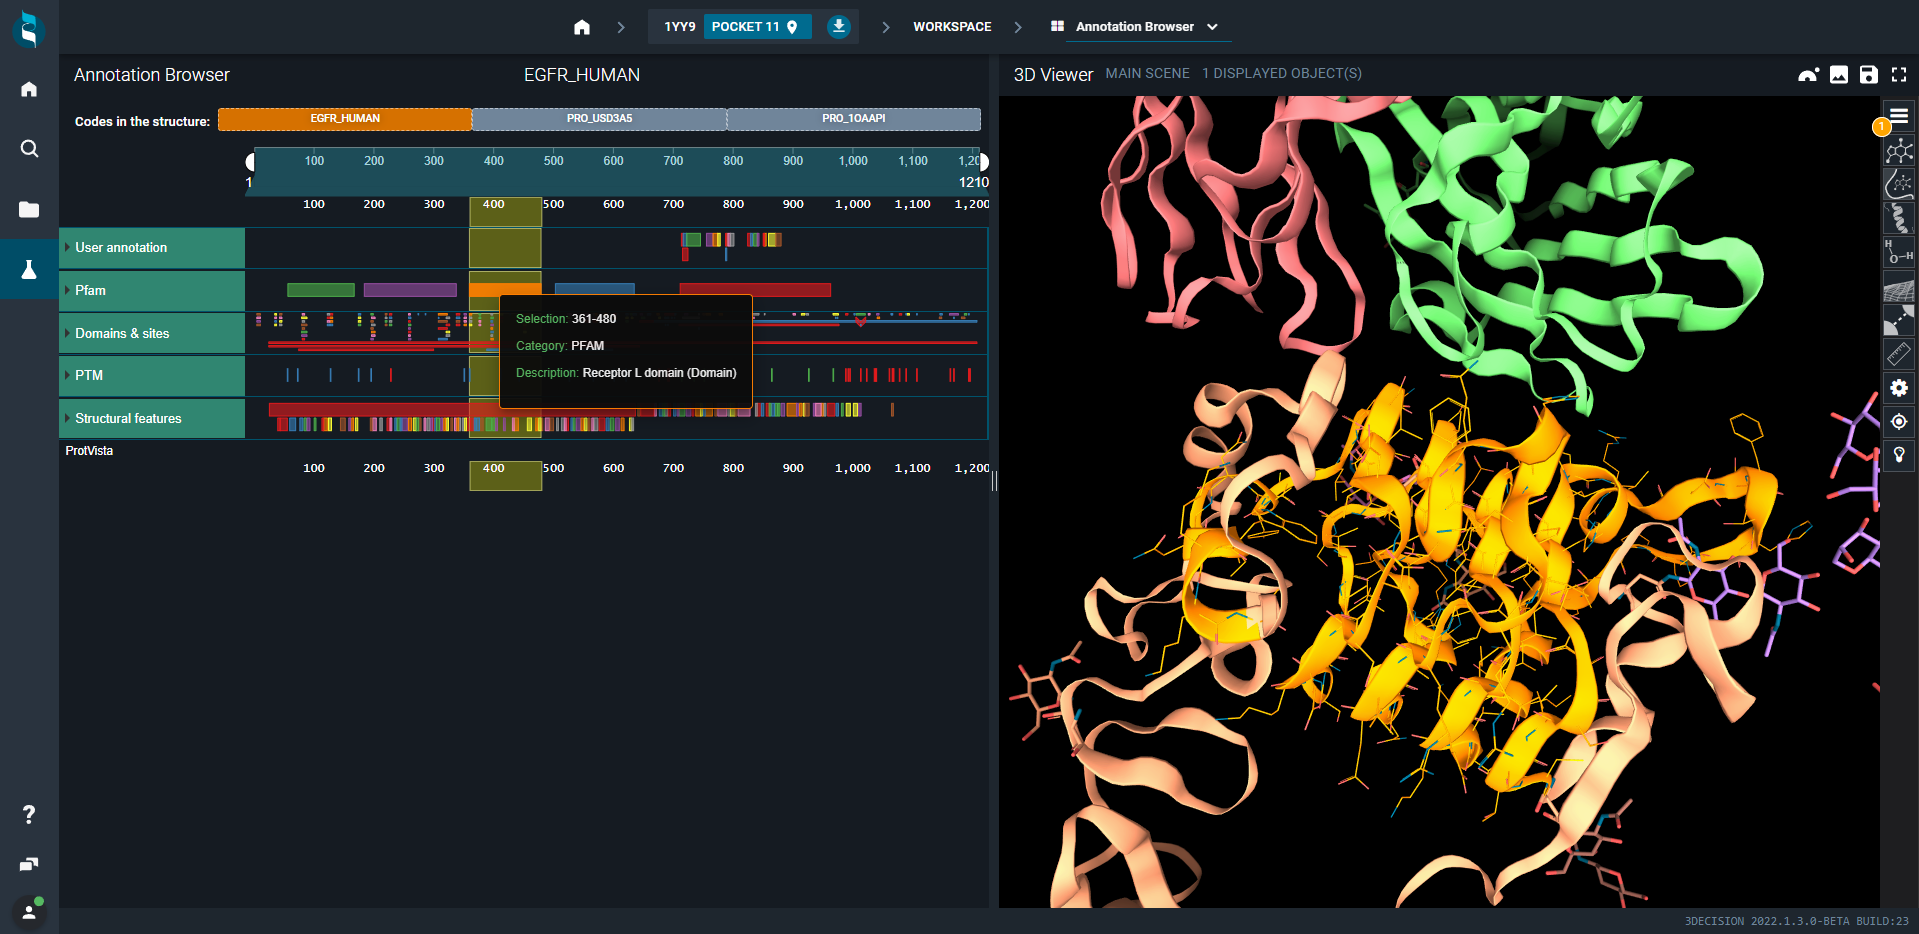
- Switch to Annotation Browser, select the antigen, i.e. EGFR_HUMAN biomolecule at the top and then the receptor L domain (orange). The focus will be done automatically on this portion of the protein.
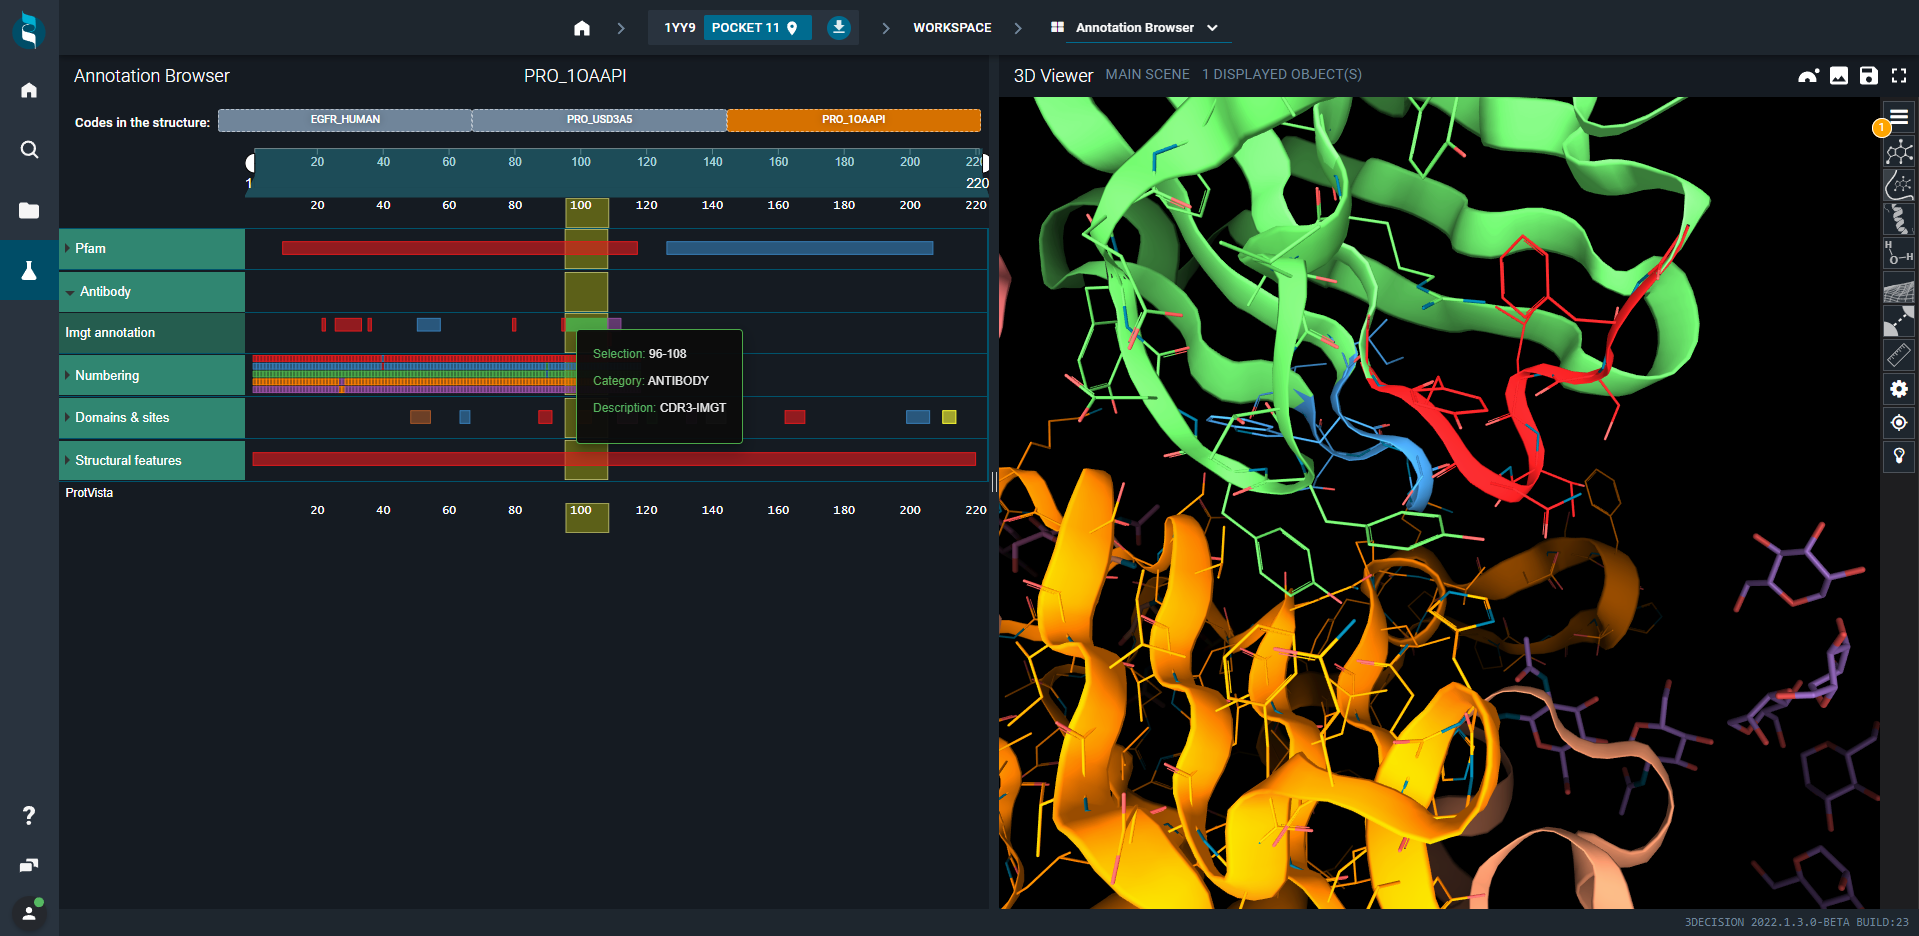
- Select now the antibody, i.e. the Cetuximab Fab Heavy chain C (third tab). Annotations are antibody-related (CDR1, CDR2, CDR3). Click on the three CDR squares. Residues that are part of these CDR are represented as lines and colored in red, blue and green.
-
In order to visualize interactions between the antibody and the protein, go back to the workspace to add protein-protein interactions. Please follow the steps from the PPI feature. In Chain set 1, select chain A and in Chain set 2, select chains C and D. Then, go back to Annotation Browser.
-
Now, if you are interested in a specific residue, you can use any of the available numberings (Kabat,Chothia, Martin, Imgt, Aho). Click on tyrosine 99 in the Kabat numbering. Then, inspect the direct and water-mediated hydrogen-bond interactions that the tyrosine side-chain established respectively with two glutamines and one histidine.
