In this use case we will show you how to quickly visualize and compare electron density (ED) maps in order to assess structures quality.
¶ Introduction
To confirm the ligand structure used for any modeling task, it is good practice to check the ED map. In particular, difference map peaks are very helpful in assessing the quality of a structure.
When you inspect a structure (using the electron density as described for the 1LEE case listed above), you frequently encounter peaks in the difference maps. These can be either negative (usually red) or positive (usually green). In short, positive peaks need to be filled with atoms, negative peaks should have their atoms (partially) removed.
Here we will show you how to quickly visualize and compare ED maps in order to spot possible modeling errors.
¶ Use Case
¶ Electron density visualization
- Search for and open 1LEE structure in the workspace
- Click on the three-dot button (...) next to the structure
- Click on fetch electron density
- Toggle on mFo-DFc map
- Look at the electron density in 3D Viewer
- Click on “Objects panel” button on the top right
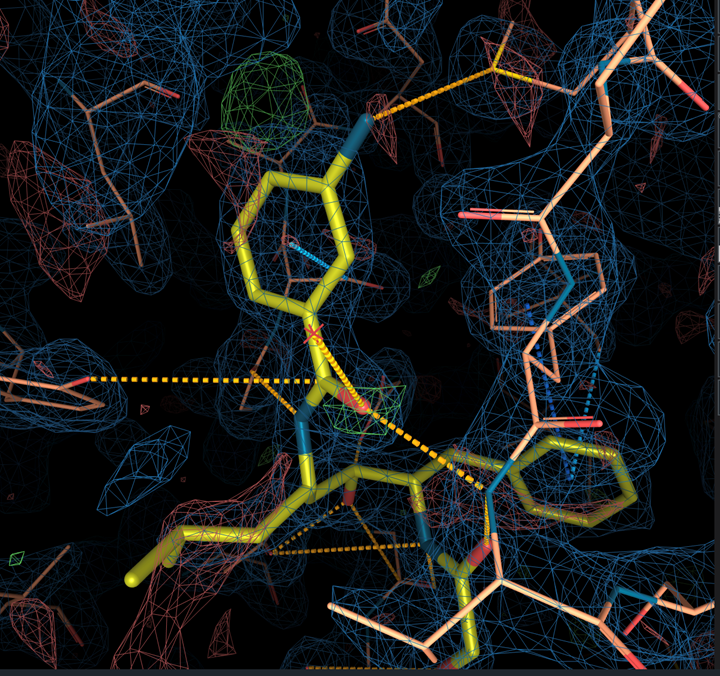
There are some default visualization parameters for electron density maps. The 2mFo-DFc map is shown at isolevel 1σ and represented by a blue mesh (wireframe). The mFo-DFc map is represented by a green mesh at isolevel +3σ and a red mesh at isolevel -3σ. The clipping box size is set to 10 Å. - Change the negative mFo map isolevel to -2σ
¶ Analysis of 1LEE map
All atoms except one nitrogen of the ligand are covered by the blue electron density (not uncommon in the more dynamic parts of a protein structure) but we can also see a positive peak (green) at the para-position of the benzene ring and red negative peak next to the nitrogen when changing the negative mFo map isolevel to -2σ.
This can suggest a wrong modeling of the ligand in the map.
¶ Electron density maps overlay
- Click on the blue button ADD STRUCTURES > From code... > PDB: 1LF2
- Superimpose structure by clicking on the eye Button
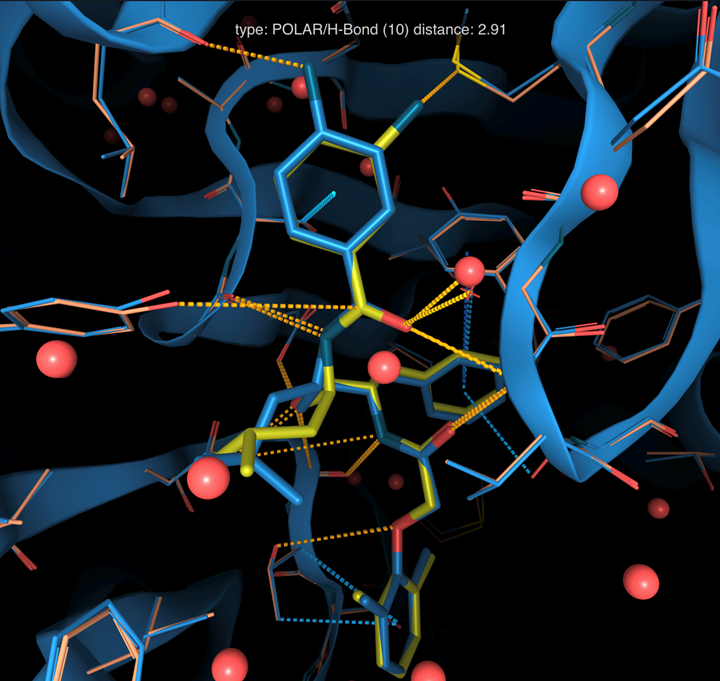
- Over with the mouse and look at the hydrogen-bond interaction with Leu131
- It is possible to superpose electron densities of multiple structures on-the-fly based on the reference pocket (as for the structures) and to change color electron density using the brush button.
- Other settings for each representation can be modified in the 3D Viewer menu: volume settings and clipping box size
As it was demonstrated by a follow up study, the wrong compound was modelled in the structure. The protein in the X-ray experiment of PDB 1LEE was cocrystallized the inhibitor RS370 (with the nitrogen in para) instead of RS367 (nitrogen in meta).

