¶ Introduction
A new frontend is now available as a beta version. It has been redesigned for:
- Improved performance and faster loading
- Modern, intuitive design
- Enhanced user experience
- New features and tools
The updates are listed below, organized by page.
¶ Homepage
 |
 |
|---|
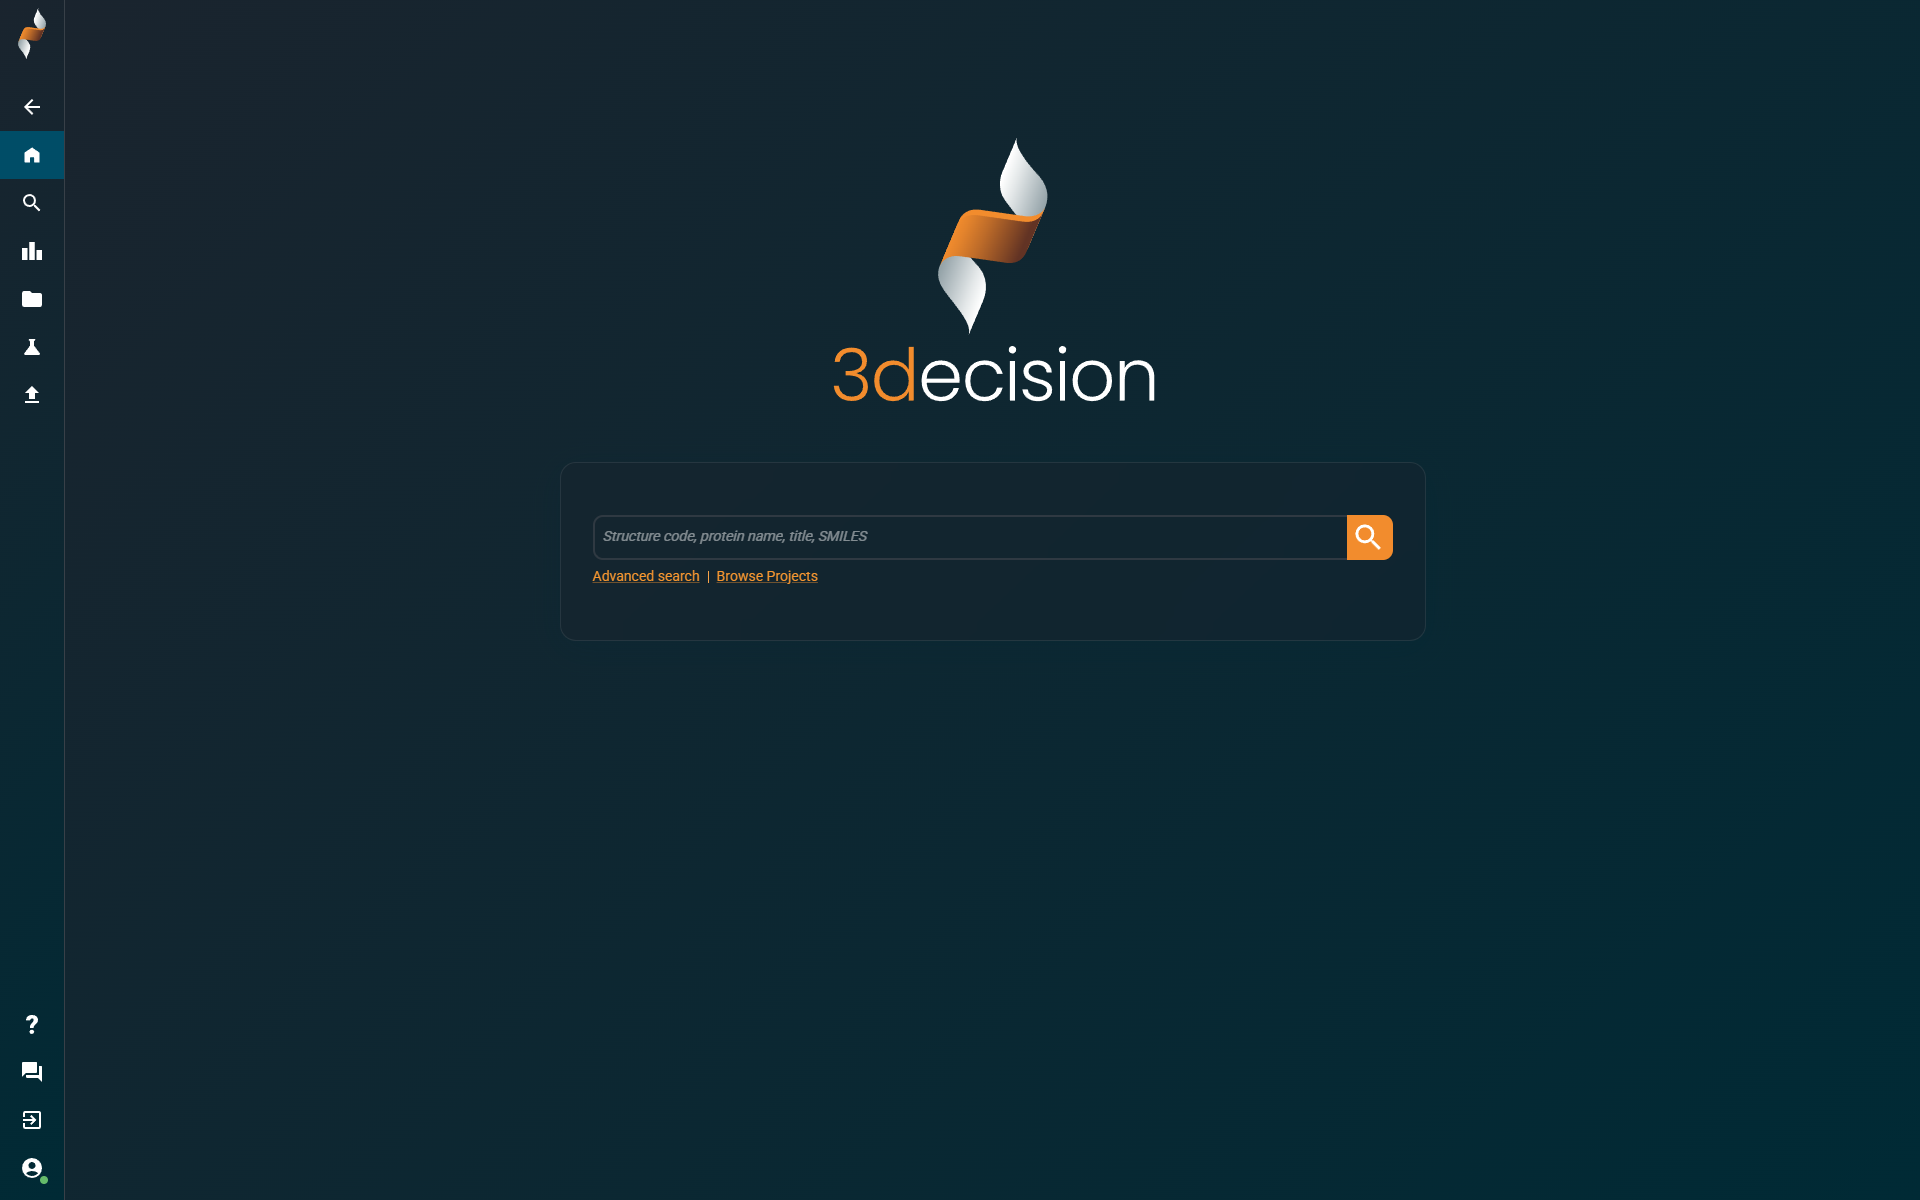
The homepage is where you can switch between the old and the new user interface. Activate the beta frontend by clicking on the icon at the bottom left:

Switch back at any time by clicking the 'Exit' icon at the bottom of the left navigation bar:

All feedback (good or bad) is highly appreciated and can be submitted through the feedback form at the bottom of the left navigation bar:

¶ Advanced search
 |
 |
|---|
¶ What Hasn’t Changed
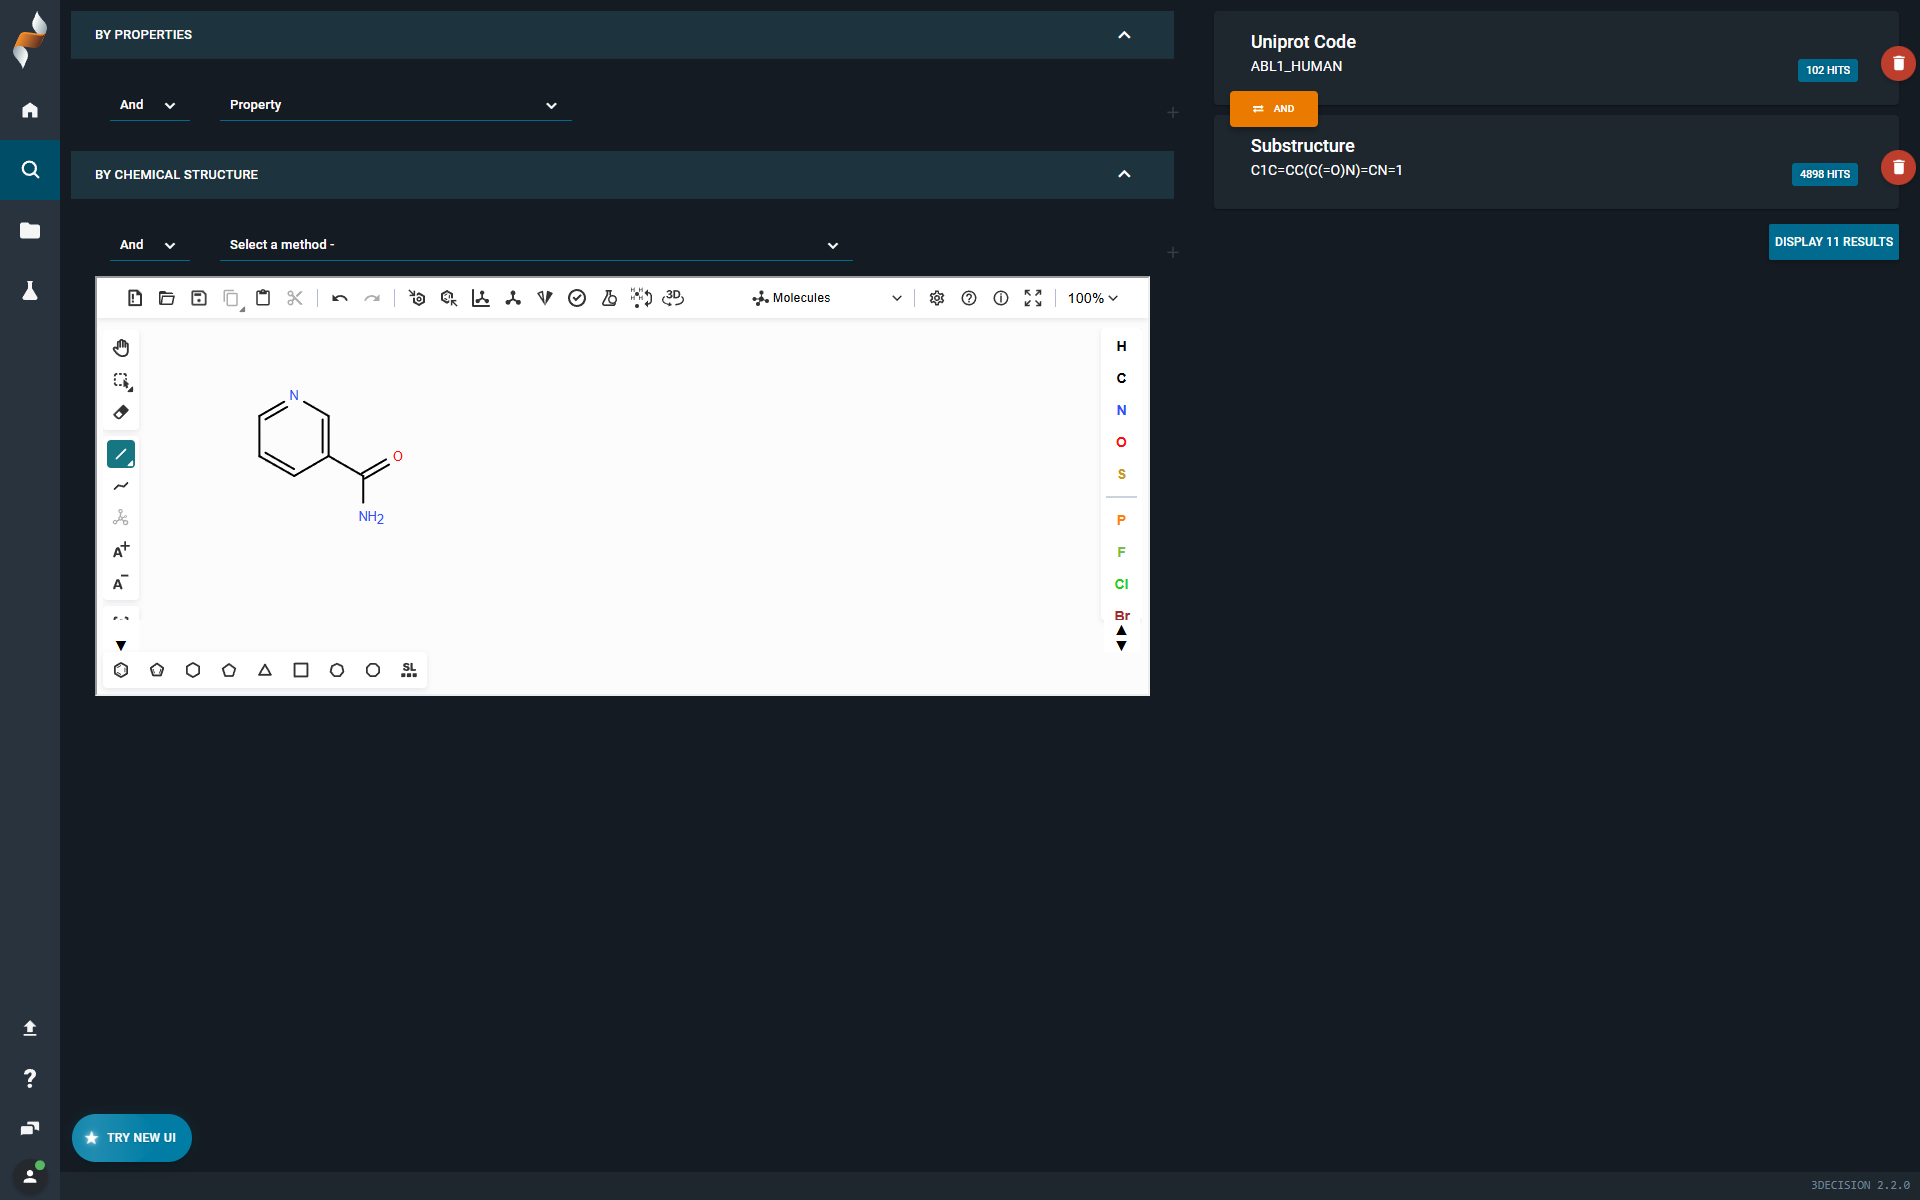
- You can still build queries by combining subqueries based on Property Search or Chemistry Search.
- Conditions AND and AND NOT are still available to combine subqueries.
- Statistics:
- For each subquery, you see the number of hits matching that specific subquery.
- The overall statistics are also displayed, showing the total number of structures that match all subqueries combined (bottom right)
- You can open hits in the Search Results page.
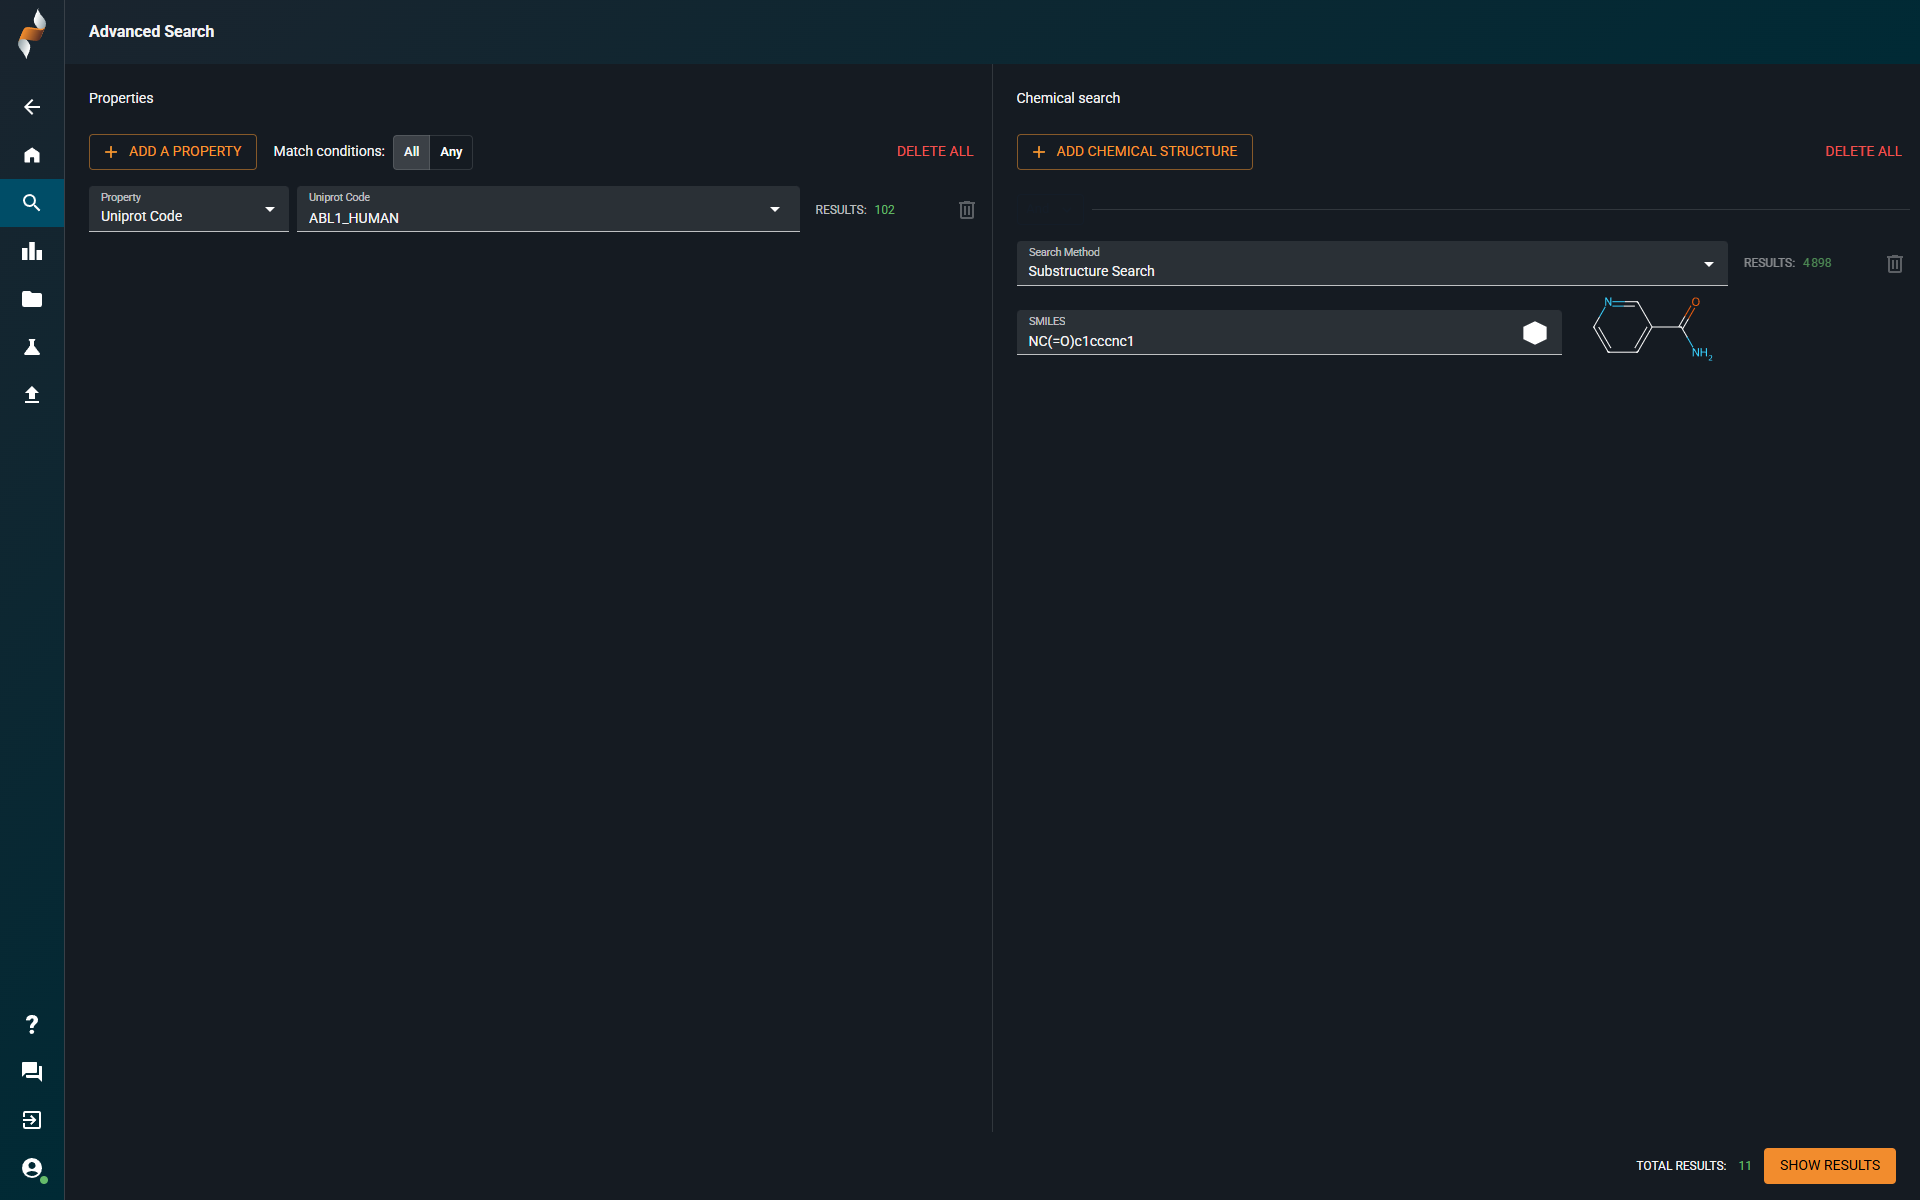
¶ What’s New
- Unified Property Panel: View all available properties in one click, without scrolling through a long list.
- Project Property: When selecting the property Project, you can scroll through all available projects.
- Editable Chemistry Subquery: Edit chemistry search subqueries using a sketcher.
- OR Condition Support: Combine subqueries using OR by setting Match Conditions to Any.
- Basic Search Subquery: You can now explicitly add a basic search subquery.
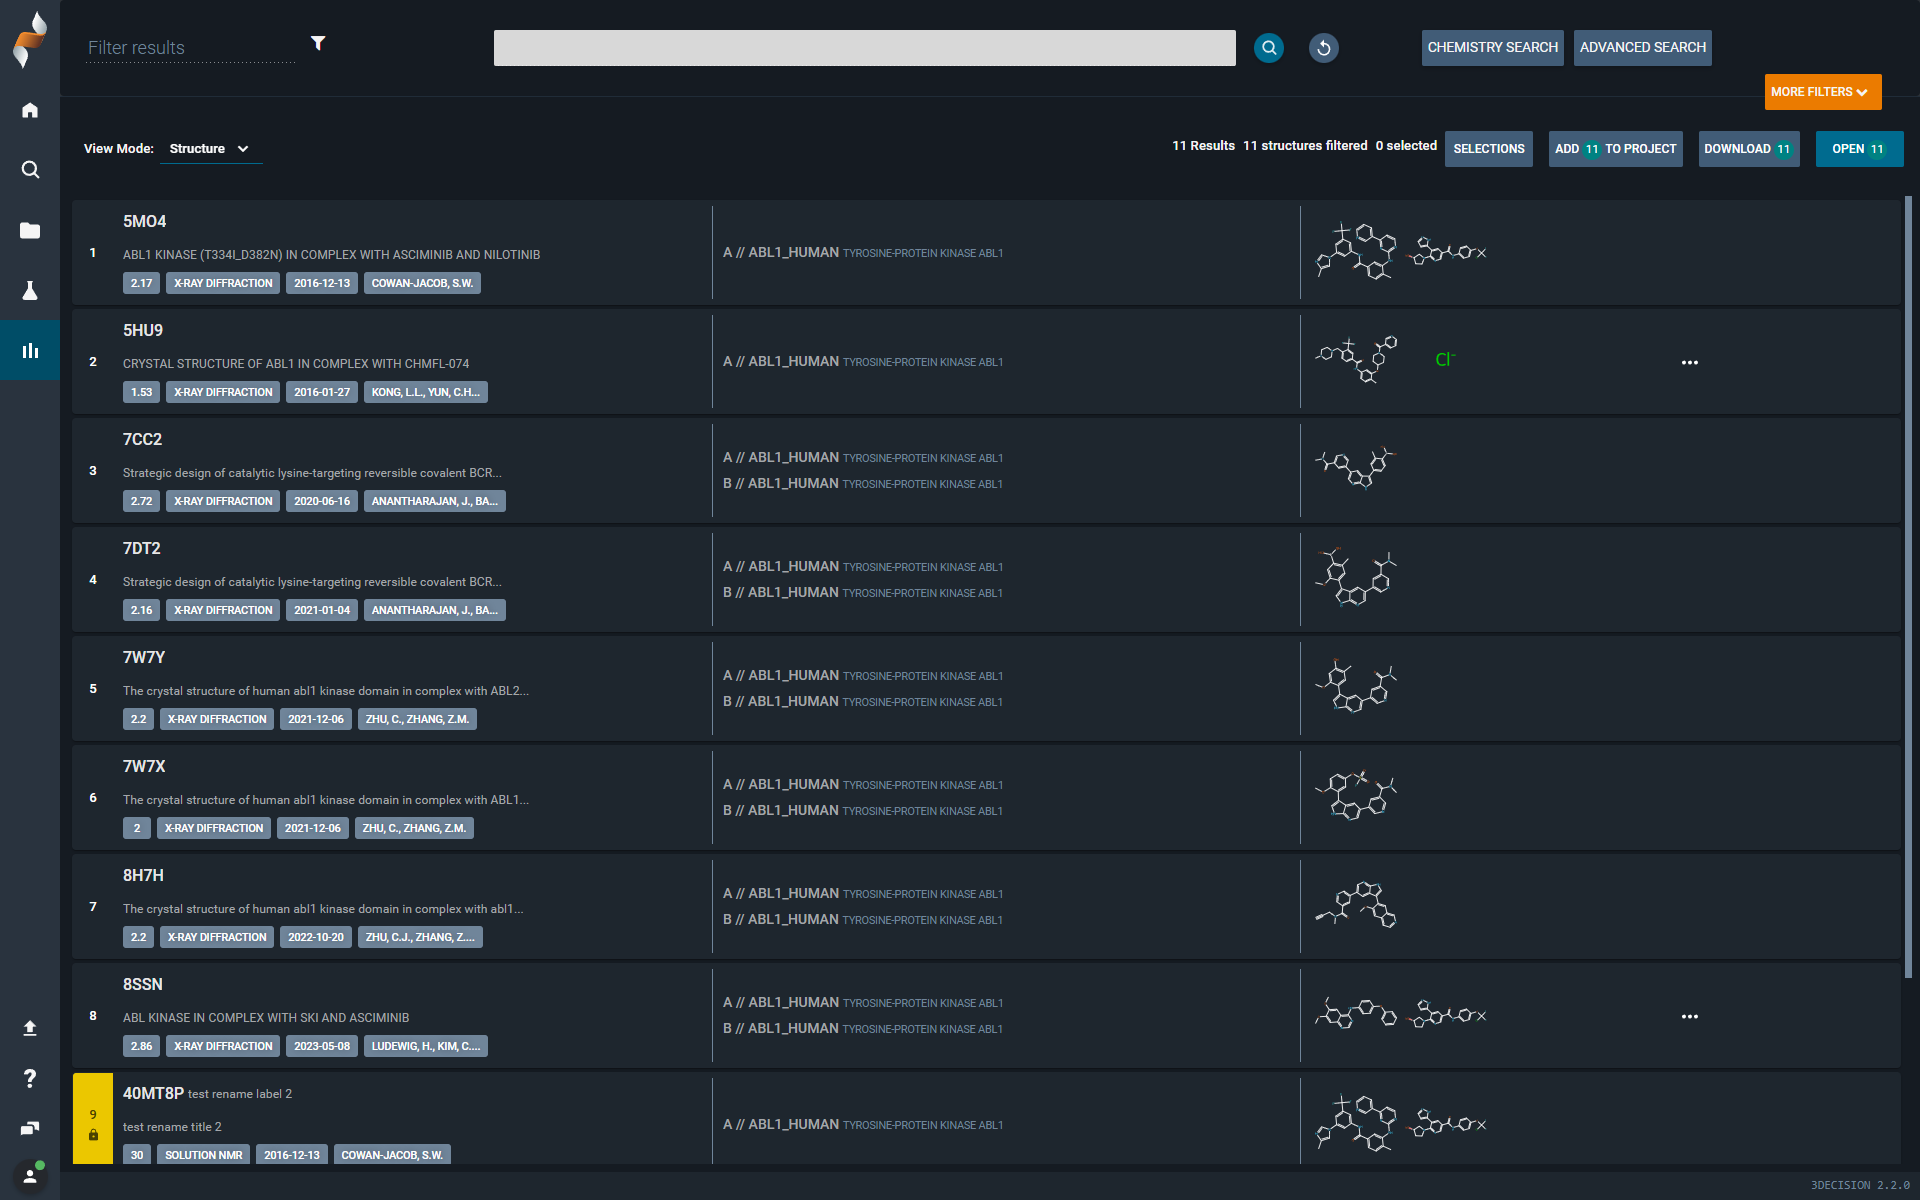
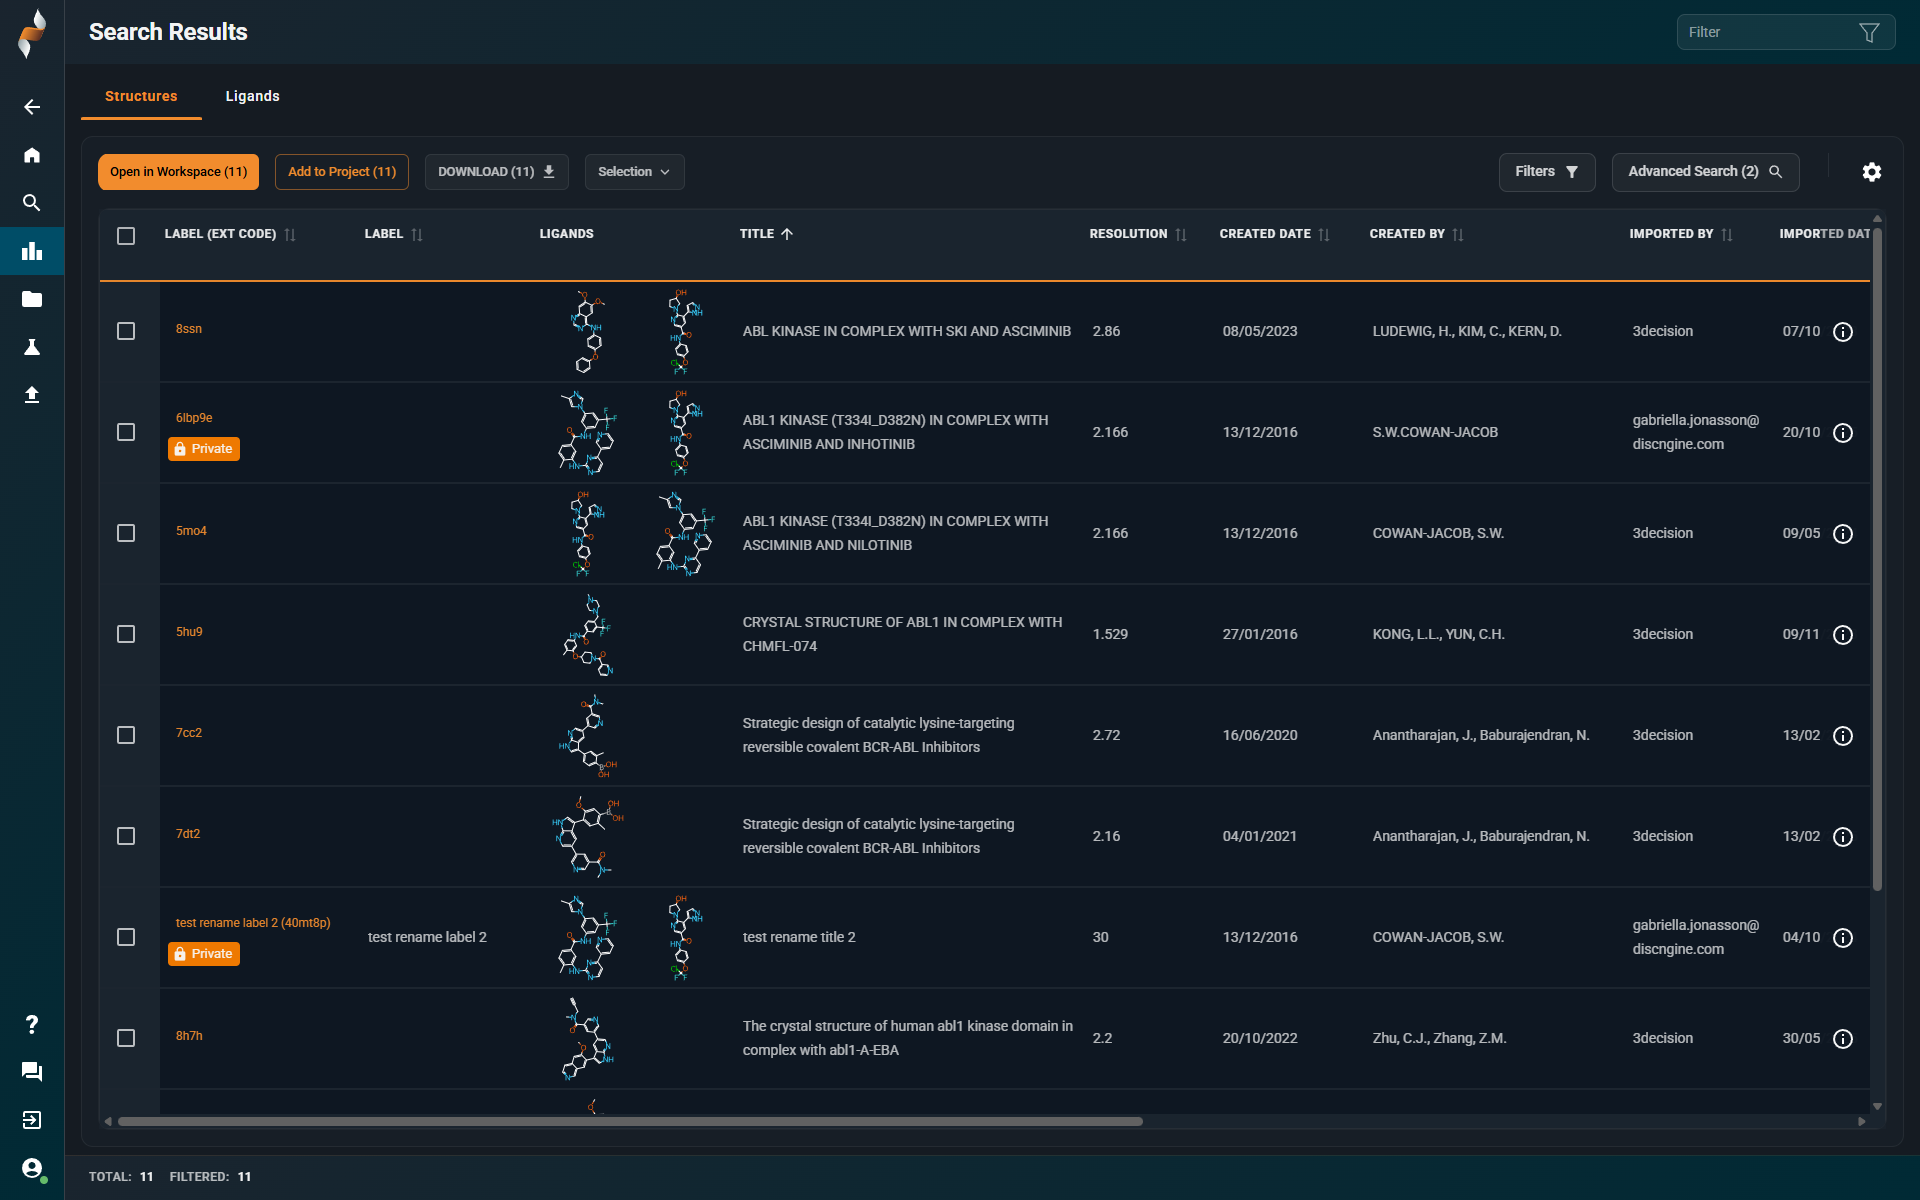
¶ Search Results Page
 |
 |
|---|
¶ What Hasn’t Changed
- Structures are still displayed in a list, with each line representing one structure entry in the database.
- Selected structures can still be
- Added to a project
- Downloaded in various formats (PDB, xlsx etc.)
- Opened in the Workspace
- Results can still be refined using post-filters and quick text search.
- Two view modes are still supported: Structures & Ligands
¶ What’s New
- You can now add additional search queries (e.g. substructure search) without leaving the page.
- You can now access the Information Browser directly, without navigating away. Great for quick verification of experimental details whthout having to load the structure into the Workspace.
¶ Structures view mode
- Sort structures by any property.
- Customize the table by editing displayed columns and adjusting their order.
- New properties available for display and sorting:
- Ligand internal identifier
- Structure internal identifier
- Select structures using checkboxes for easier bulk actions.
- Quick access to a 3D-structure: direct link to the Workspace on each structure code (external code)
- New post-filter options:
Contains drug-like ligand(in addition to “Contains ligand”)Imported by(user who imported the structure)Created by(author of the structure file, from PDB AUTHOR)Imported date(date the structure was imported into 3Decision), and not onlyCreated date(date the structure file was created, date in PDB HEADER)
¶ Ligand View Mode
- All ligands of a structure are now displayed (previously only the first ligand was shown).
- Non-drug-like small molecules (e.g., buffer molecules, ions) are hidden by default. You can display them by changing the
Show Drug-like Onlyfilter option. - The full list of internal ligand identifiers is now visible on the ligand cards.
¶ Project list
¶ What’s New
- Sort Projects on:
- Title
- Description
- Created date
- Created by
- Type
- Number of structures
- You can now select several projects and bring them to the search result page for further refinement.
¶ Project Dashboard
¶ What’s New
- The page has been re-organized into 4 tabs:
- Structures
- Ligands
- Files
- Users and Groups
- Add structures directly within a project – No need to navigate away; you can now find and add strctures from the project panel itself.
- Sort structures by any property.
- Customize the table by editing displayed columns and adjusting their order.
- Hide all solvent molecules by applying the filter
Show Drug-like Only.
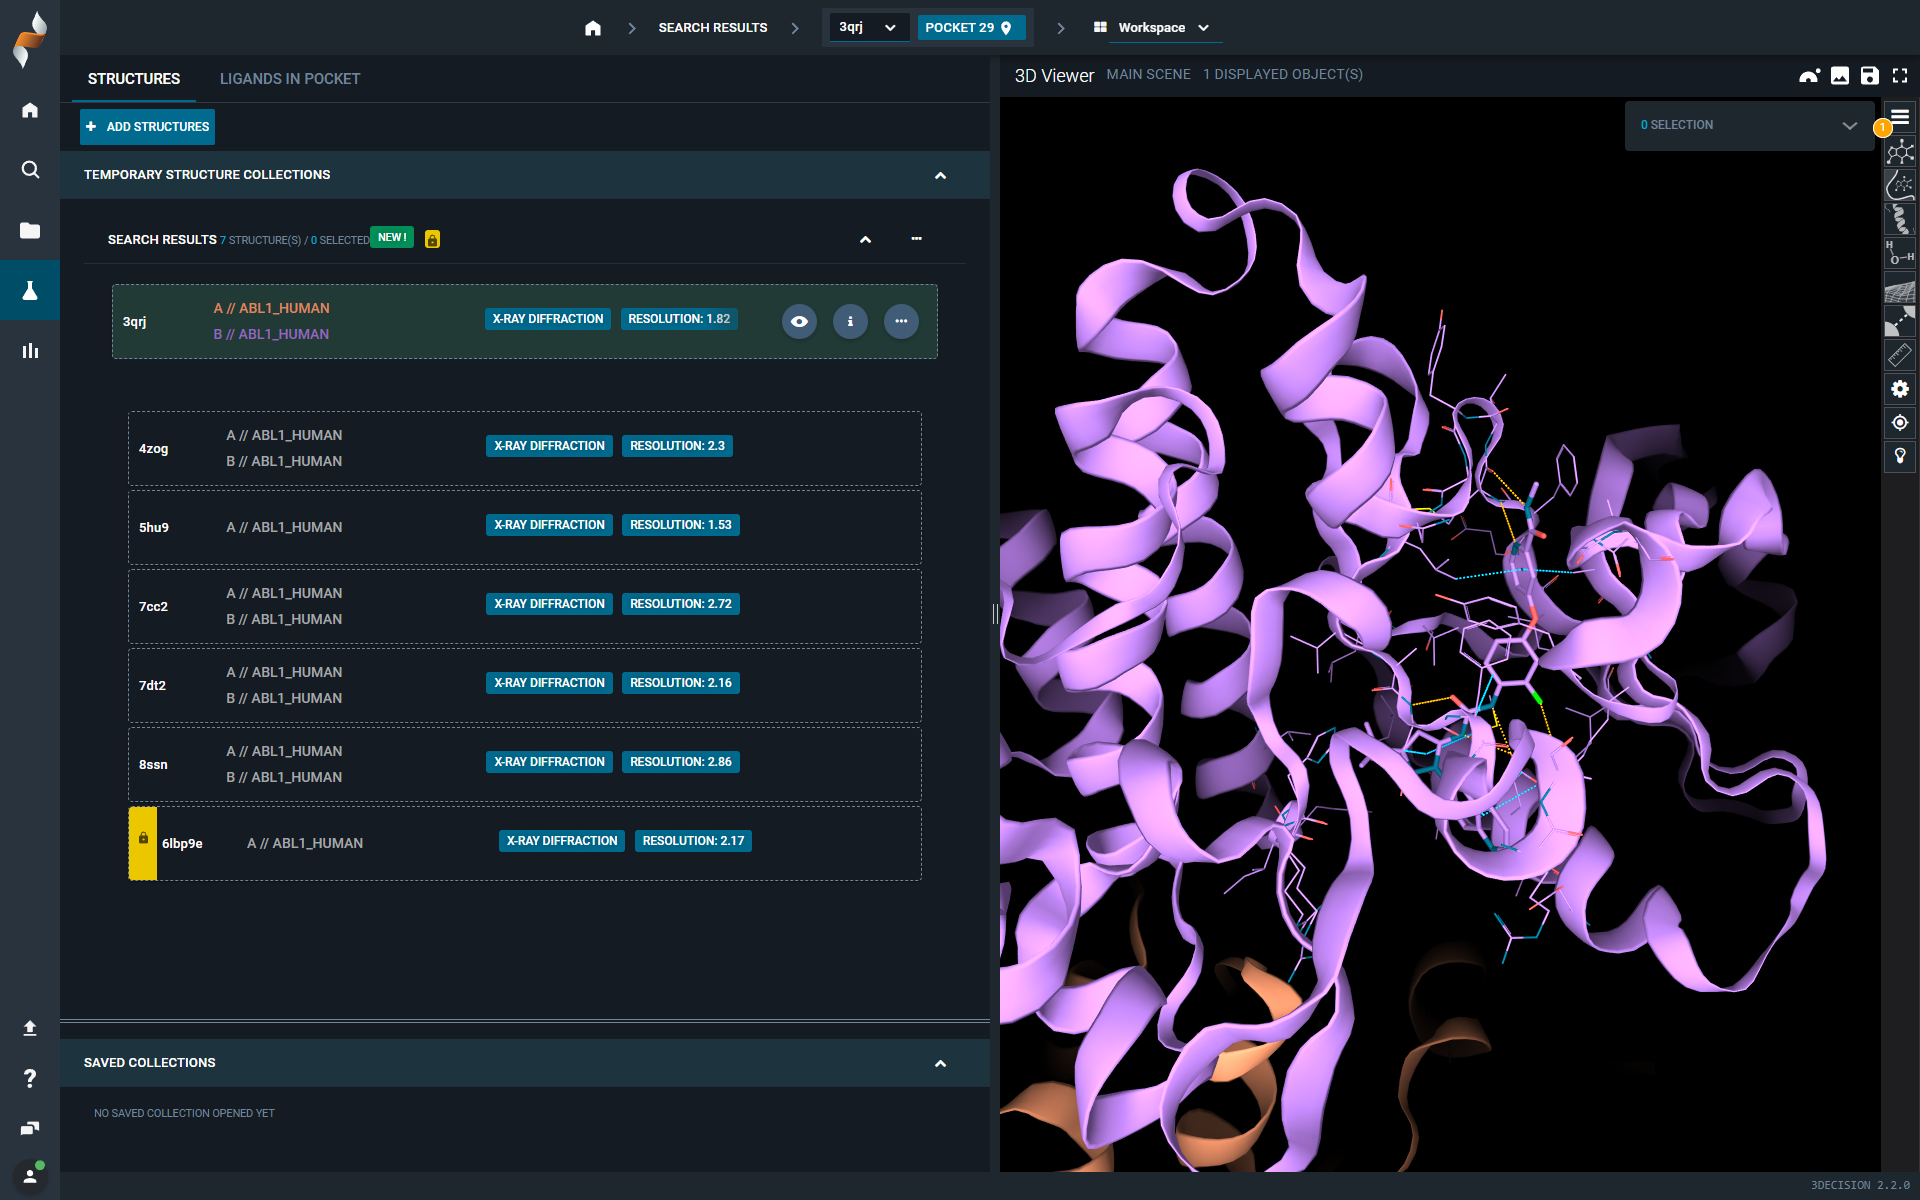
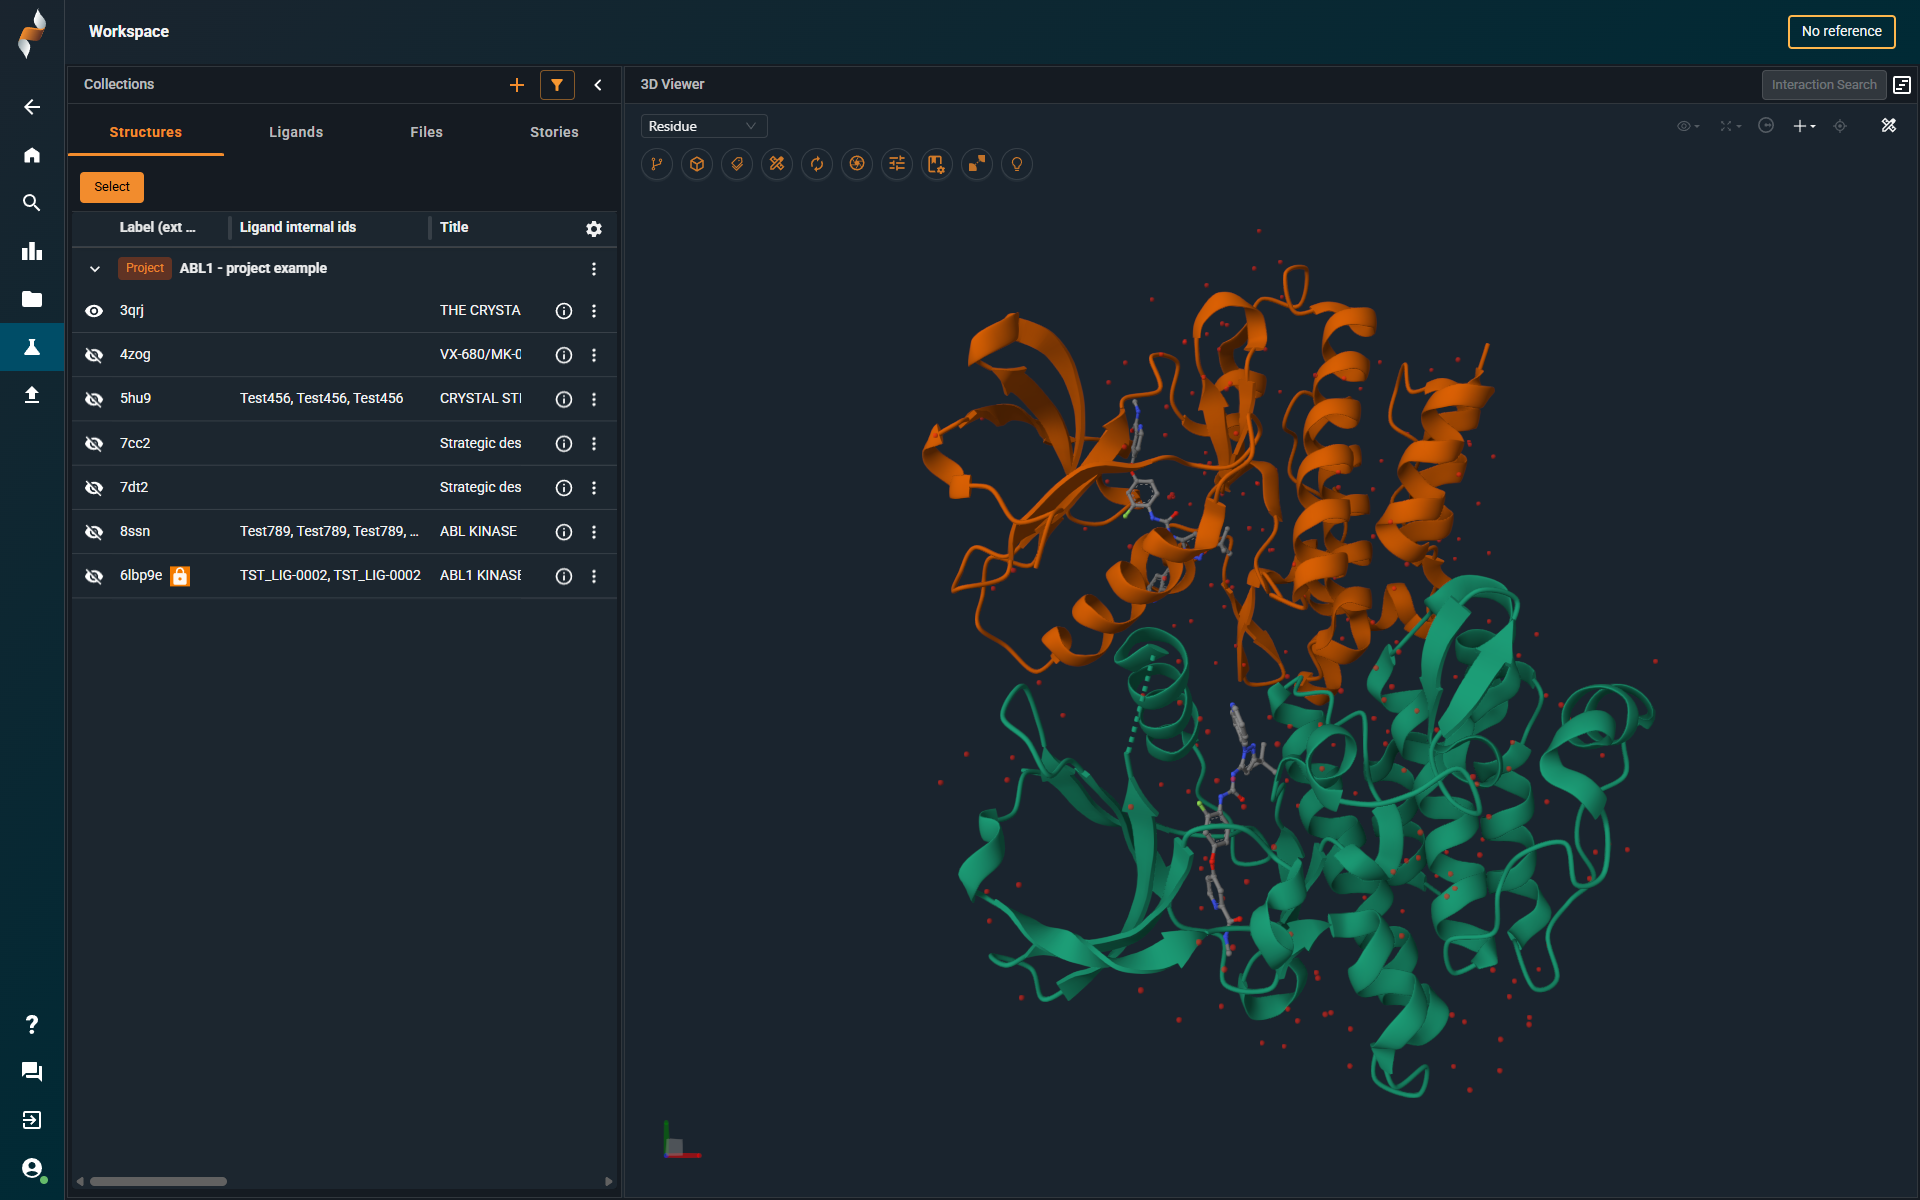
¶ Workspace
 |
 |
|---|
¶ What Hasn’t Changed
- The list of structures loaded into the Workspace is displayed on the left-hand side and organized into collections.
- The default view is a list of structures, but you can switch to Ligand View mode at any time.
- The Information Browser is accessible via the ⓘ icon on each structure.
- By default, the first structure in the collection is loaded into the 3D viewer; the others are only loaded when explicitly requested by the user.
- Ligand interactions are automatically loaded in the 3D viewer.
¶ What’s New
General Updates
- Improved space usage with reduced padding and a more condensed view.
- Customizable structure list, allowing users to display the identifiers that matter most (e.g., titles, compound numbers).
- The Ligands tab now displays all ligands in the structures, not just those in the reference pocket.
- New 3D viewer (see dedicated section below).
- Stories (see dedicated section on Stoyboard below).
- New Annotation Browser.
- You can enter full-screen mode in the 3D viewer by clicking the Collapse Collections arrow in the top-right corner of the collection panel.
- Preset workspace layouts are no longer available in the top navigation bar. Users can now create custom layouts by combining different panels:
- Open the list of pockets detected in the structures by selecting Show Pockets in the Structure Action menu ( ⠇ icon).
- Open the Annotation Browser by clicking the Show Annotation Browser icon in the top-right corner of the screen.
- Open the Information Browser by clicking the ⓘ icon on the structure row.
Sructure overlay rules
No Workspace reference is set by default. If you want to apply an automated superposition rule, follow these steps:
- Define a structure as the Workspace reference by clicking Set as Reference in the Structure Action menu (⋯ icon).
- Select a superposition rule:
- Pocket-centric
- Chain/Residue-centric
Pocket Panel
- Interactive 3D Viewer: Hover your mouse over a pocket to highlight its location on the structure.
- Enhanced Readability: Adjust column widths in the table to view the complete list of residues.
¶ Storyboard: A New Way to Share and Collaborate
Storyboard is an innovative feature that lets you save collections of 3D scenes with descriptive text to create shareable projects or structured stories. It helps you highlight the details that truly matter in a structure, so teams can stay focused and collaborate more effectively.
¶ How to Create a Storyboard
-
Add Structures to a Project
Start by adding your structures to a project and opening it in the Workspace. You can also use an existing project. -
Open the Stories Tab
In the Collections panel, go to the Stories tab:
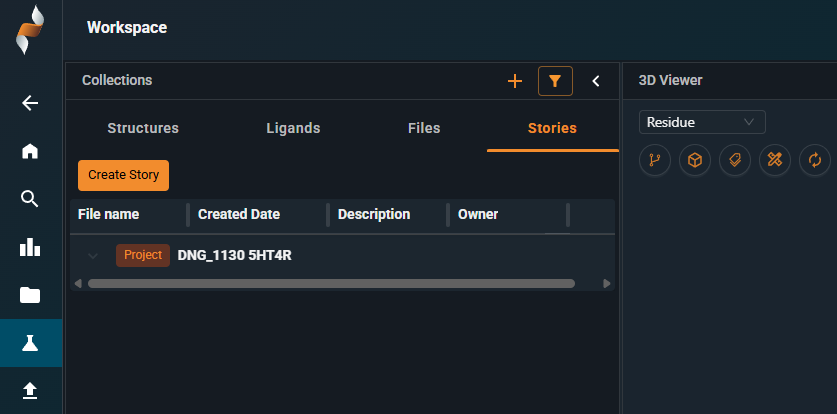
-
Create a New Story
Click Create Story. -
Add a Title and Description
Enter a title and description for your storyboard. These are required to save your work. -
Customize Your First Scene
A first scene is automatically created based on what’s currently loaded in the 3D viewer. You can adjust representations, zoom, or clipping planes as needed. When ready, click Update (top right) to save your changes. -
Edit Scene Details
You can also edit the title and description of each scene. -
Add More Scenes
Use the Add Scene button in the left-hand panel to include additional views.
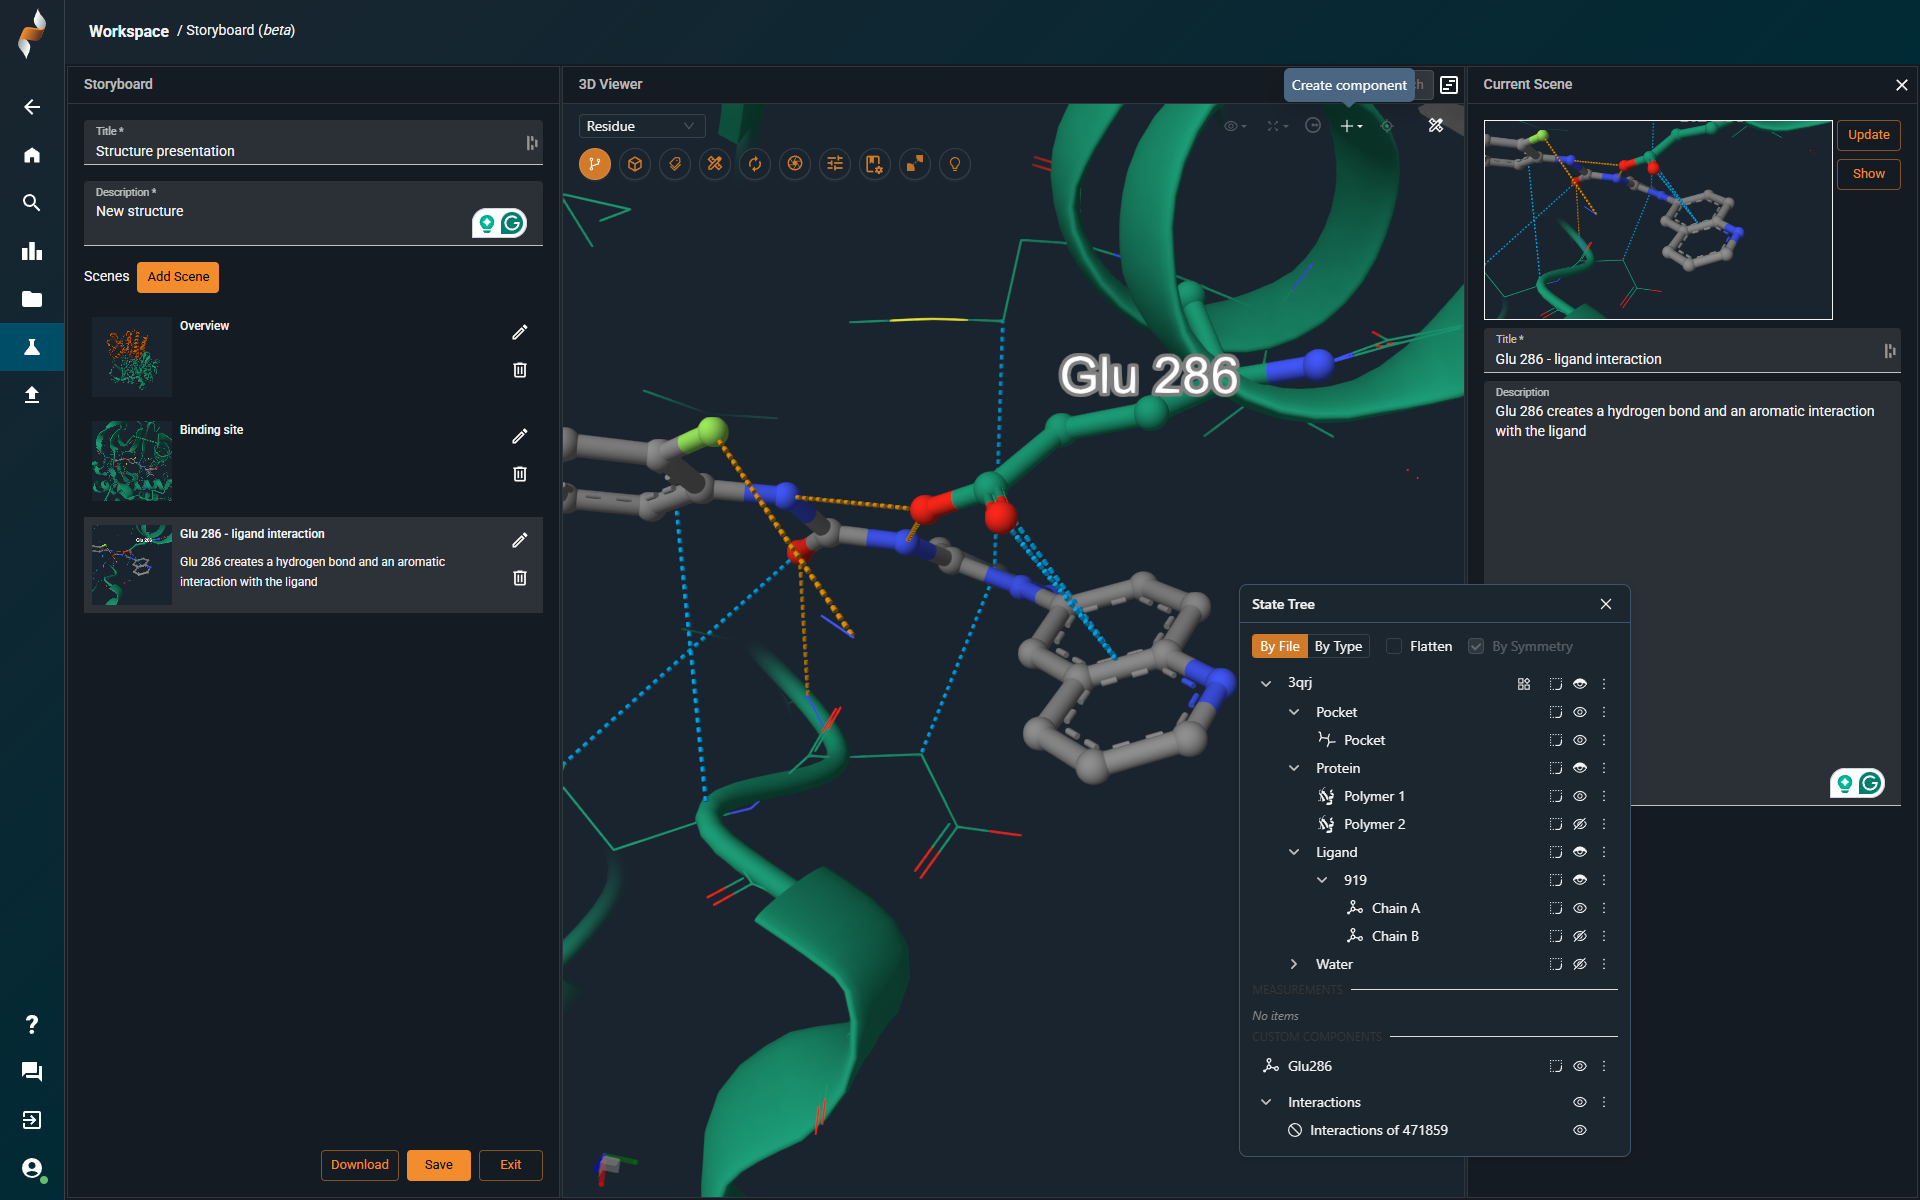
- Save Your Storyboard
When finished, click Save at the bottom left.
¶ How to Share a Storyboard
-
Verify Access
Make sure the user or user group you want to share the storyboard with is part of the project where the storyboard was created. If not, add them to the project. -
Copy the Project URL
Open the project in the Workspace and copy the browser URL. It should look something like this:
https://3decision-reg.discngine.cloud/workspace?ws=15-project-id%7E7795 -
Provide Instructions to Your Colleague
Share the link along with these steps:- Go to the Stories tab in the Collections panel.
- Click the action menu icon (three dots) next to the story (each story appears as an item in the table).
- Select View.
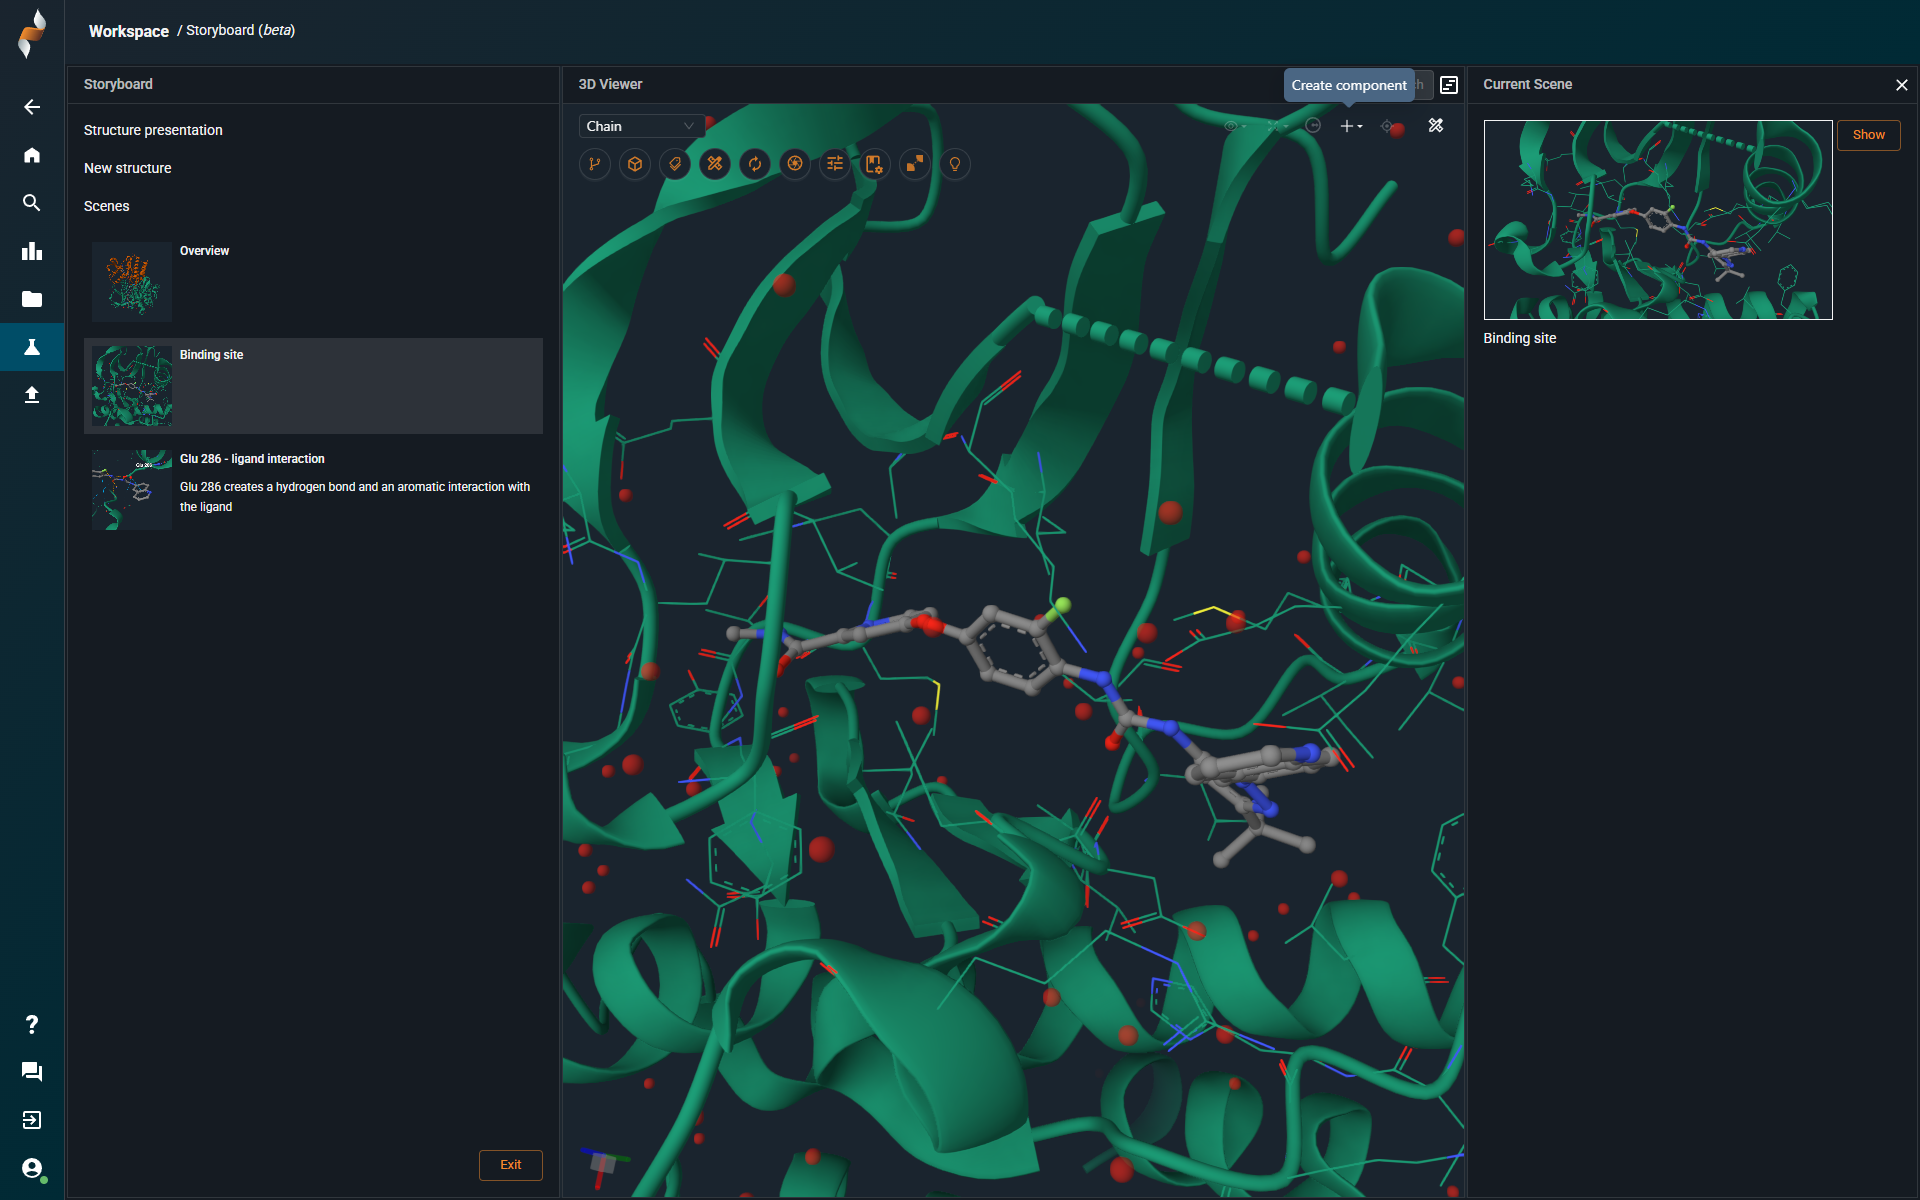
The storyboard will open in view mode, allowing the user to walk through each scene and interact with the 3D viewer:
¶ New 3D-viewer
All interactive controls — including action buttons and tools — are now conveniently located at the top of the 3D Viewer interface. In the this section, we'll walk through each of these features in detail to help you understand their purpose and how to use them effectively.
For guidance on performing common tasks in the 3D Viewer, refer to the following tutorial categories:
¶ State Tree
 |
The State Tree is a central panel in the 3D-viewer that displays all structures currently loaded into the scene. It provides a hierarchical view of each structure and its components, allowing users to interact with and customize how each part is visualized. |
¶ Structure Organization
Loaded structures are automatically categorized by component type:
- Proteins
- Ligands
- Nucleic acids
- Ions
- Water molecules
Each category can be expanded to reveal sub-elements, such as individual chains or ligands.
¶ Representation Controls
For each item in the State Tree, users can:
- Show or hide the element in the 3D scene.
- Add visual representations, such as: Surface, Ball-and-stick, Cartoon etc.
- Change coloring schemes, including by element, chain, or custom selections.
¶ Components
 |
The Components option lets you show or hide all items of a specific type — like proteins or ligands — across all structures with a single click. |
¶ Labels
 |
The Label option lets you add custom labels to any object or selection in the 3D viewer, making it easier to highlight and annotate specific regions of interest.. |
¶ Create New Components
To create a custom component, select any part of a structure — such as a binding site or residue — and click "Component from Selection" under the ➕ icon in the top-right corner:
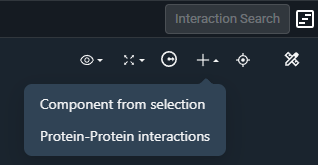
The new component will appear in the State Tree, where you can adjust its visibility, representation, and coloring just like any predefined element.